
Vertical Dilations of the Square Root Graph
Loading the math board and drawing, please wait…
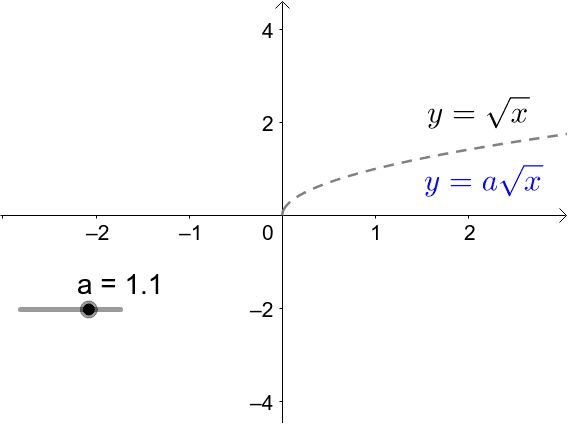
This example demonstrates the vertical dilation of the square root function y = √x, allowing users to dynamically adjust a parameter a to see how the graph is stretched or compressed vertically. The core mathematical concept is vertical dilation of function graphs: multiplying the function by a positive coefficient a scales every y-coordinate by a factor of a while keeping x-coordinates unchanged. Construction highlights: using GeoGebra's function object f to define the base square root function, a slider or parameter a to control the dilation factor, and text objects text1 and text1_1 to display the current function expression or explanatory notes for interactive observation. Suitable for middle school mathematics lessons on function transformations and graph properties, as well as pre-calculus review, helping students intuitively grasp how parameter changes affect function graphs.
GeoGebra Commands & Parameters
Numeric a(1.1)f(x) = sqrt(x)Function g
AI Drawing Prompt Reference
Draw a coordinate plane with a square root function curve starting from the origin and extending to the upper right. Include an adjustable numeric parameter that controls the vertical stretch or compression of the curve: when the parameter is greater than 1, the curve is stretched vertically; when less than 1, it is compressed. Display the current function expression, such as "y = a√x", along with the current value of the parameter. The layout should clearly show how changing the parameter affects the curve's shape, making it easy to observe the transformation.
The prompt above was compiled from the original drawing commands and is for reference only.