
Horizontal Translations of the Square Root Graph
Loading the math board and drawing, please wait…
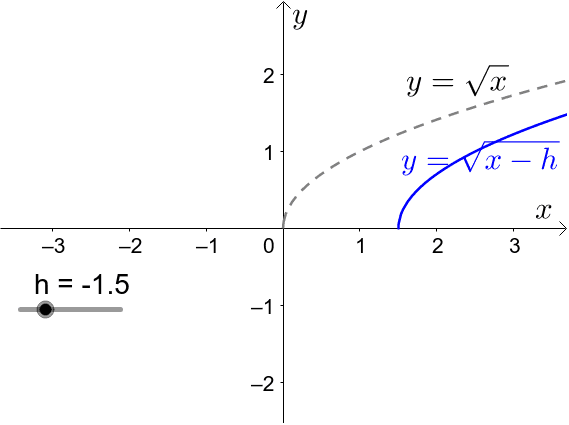
This example demonstrates how the graph of the square root function y = √x is horizontally translated when the parameter h in y = √(x - h) changes. It visually shows the shift of the curve along the x-axis, reinforcing the concept of function transformations. Core mathematical concepts include horizontal translation, function notation, and domain shifts. The construction uses GeoGebra objects such as functions f and g to represent the original and translated graphs, a slider h to control the translation amount, and text objects (text1, text1_1, text2, text3) to display expressions or annotations. This is suitable for middle or high school students learning function transformations, and can be used for classroom demonstrations or self-guided exploration to understand the 'left add, right subtract' rule and its effect on the domain of the square root function.
GeoGebra Commands & Parameters
Numeric h(-1.5)f(x) = sqrt(x)Function g
AI Drawing Prompt Reference
Draw the graph of the function y=√x, and observe its horizontal translation along the x-axis by sliding the parameter h. Initially set h to -1.5, and let function g represent y=√(x-h). First, draw the graph of y=√x, then add a slider h to control the translation distance, and finally draw the graph of the translated function g.
The prompt above was compiled from the original drawing commands and is for reference only.