
Vertical Asymptote (Defined as a Limit)
Loading the math board and drawing, please wait…
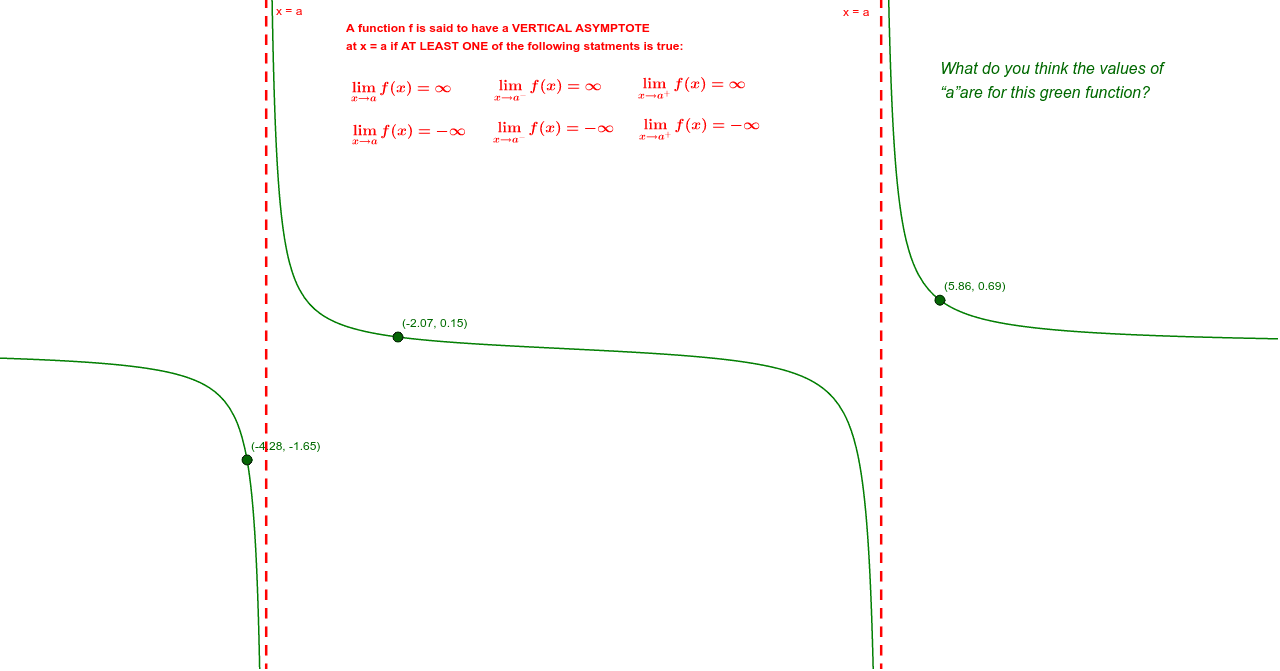
This GeoGebra applet demonstrates the formal definition of a vertical asymptote as a special type of nonexistent limit. It shows how a function approaches positive or negative infinity as the input approaches a specific value, making the vertical line an asymptote. The core mathematical concepts are limits, one-sided limits, and asymptotic behavior. The construction uses the Point command to define key points and multiple text objects (text1, text2, etc.) to display limit expressions and function values. Dynamic parameters a and b allow users to manipulate the function and observe how the graph behaves near the asymptote. This resource is ideal for high school or introductory college calculus students to grasp the connection between limits and graphical features, and can be used for classroom demonstrations or self-paced exploration.
GeoGebra Commands & Parameters
Point(f) → APoint(f) → BPoint(f) → C
AI Drawing Prompt Reference
Draw a graph of a function with a vertical asymptote defined by a limit. Place three distinct points on the curve, positioned on different sides or at varying distances from the asymptote, to illustrate how the function approaches positive or negative infinity as the input nears the vertical line. Include sliders to dynamically adjust the function's parameters, altering the curve's shape while keeping the asymptote fixed. Add text annotations displaying limit expressions and function values at the selected points, clarifying the connection between one-sided limits and asymptotic behavior. The overall layout should emphasize the function's dramatic change near the asymptote, suitable for teaching limits in calculus.
The prompt above was compiled from the original drawing commands and is for reference only.