
Venn Diagram: Two-Set Combined Events
Loading the math board and drawing, please wait…
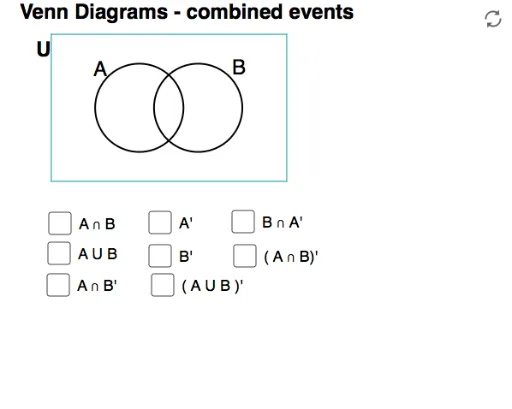
This GeoGebra example visualizes a Venn diagram with two sets, demonstrating the logical relationships of union, intersection, and complement of combined events. Core mathematical concepts include set theory operations (union, intersection, complement) and probability of joint events. Construction uses GeoGebra commands such as Point, Circle, Intersect, Polygon, and CircleArc to draw and shade the circular regions and their overlaps. Ideal for high school mathematics, probability statistics, and set theory lessons.
GeoGebra Commands & Parameters
Point(xAxis) → ECircle(E, 3) → ePoint(xAxis) → FCircle(F, 3) → fIntersect(e, f) → G, H, ,CircleArc(F, G, H) → gCircleArc(E, H, G) → hCircle(F, 3) → kCircle(E, 3) → pPoint(e) → APoint(f) → RCircumcircleArc(G, A, H) → sCircleArc(F, G, H) → tCircumcircleArc(G, R, H) → e_1CircleArc(E, H, G) → f_1Polygon(I, L, K, J) → poly4, i_1, l_1, k_1, j_1Circle(F, 2.95) → g_1Circle(E, 2.95) → h_1CircleArc(F, G, H) → q_1CircleArc(E, H, G) → r_1
AI Drawing Prompt Reference
Draw a Venn diagram with two overlapping circles. The centers of the circles are on the horizontal axis, with equal radii. The overlapping region should be highlighted with a shadow. The diagram should illustrate the concepts of union, intersection, and complement. Construct by drawing the two circles first, then determining their intersection points, and finally drawing the shaded area and related lines.
The prompt above was compiled from the original drawing commands and is for reference only.