
Mutually Exclusive Events Venn Diagram
Loading the math board and drawing, please wait…
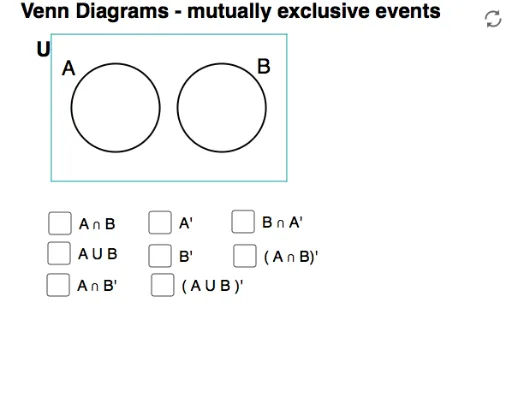
This GeoGebra example constructs a two-set Venn diagram to visually demonstrate mutually exclusive events in probability theory. The diagram depicts two non-overlapping circular regions, emphasizing that the intersection of the two events is empty. Core mathematical concepts include mutually exclusive events, set operations (union and intersection), and the geometric interpretation of probability addition rules. The construction leverages GeoGebra commands such as Point, Circle, Intersect, CircleArc, and Polygon, following a step-by-step approach of defining points, drawing circles, computing intersections, and forming polygonal closures. It is suitable for high school mathematics, particularly in probability and statistics units, and serves as an effective teaching tool for helping students grasp the geometric and algebraic properties of mutually exclusive events.
GeoGebra Commands & Parameters
Point(xAxis) → ECircle(E, 3) → ePoint(xAxis) → FCircle(F, 3) → fIntersect(e, f) → G, H, ,CircleArc(F, G, H) → gCircleArc(E, H, G) → hCircle(F, 3) → kCircle(E, 3) → pPoint(e) → APoint(f) → RCircumcircleArc(G, A, H) → sCircleArc(F, G, H) → tCircumcircleArc(G, R, H) → e_1CircleArc(E, H, G) → f_1Polygon(I, L, K, J) → poly4, i_1, l_1, k_1, j_1Circle(F, 2.95) → g_1Circle(E, 2.95) → h_1CircleArc(F, G, H) → q_1CircleArc(E, H, G) → r_1