
Venn Diagram Shading and Set Operations Visualization
Loading the math board and drawing, please wait…
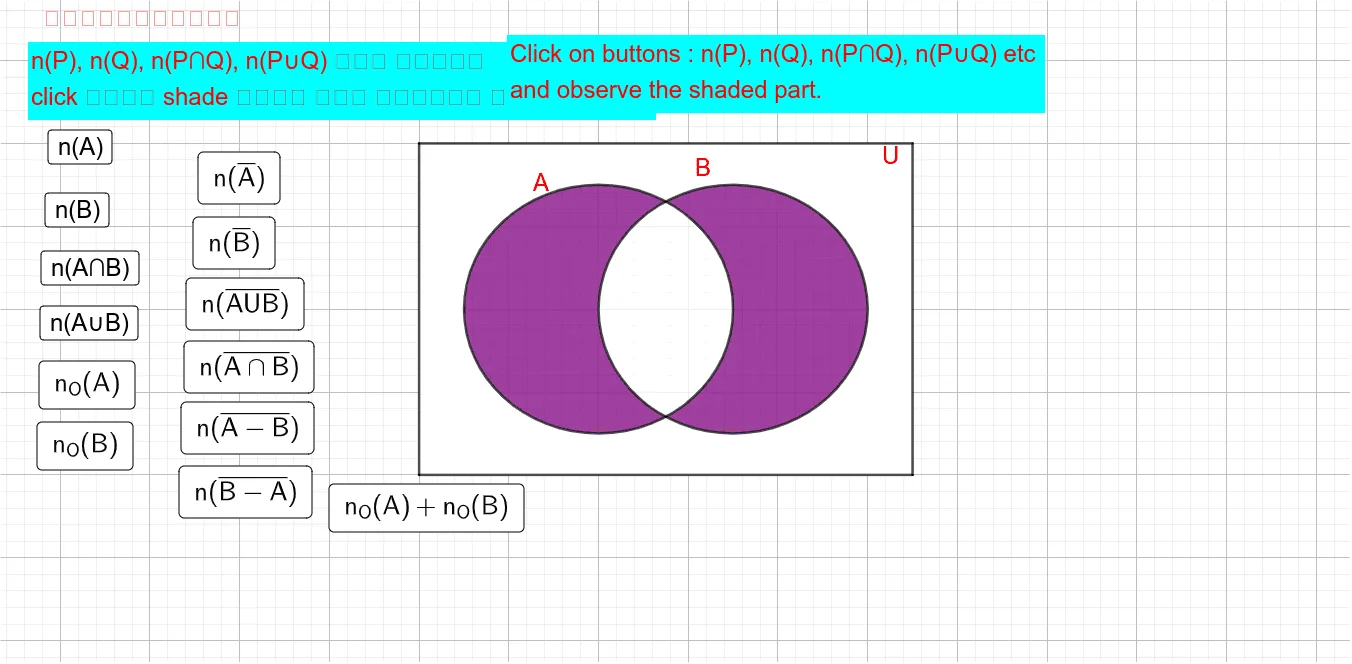
This GeoGebra example demonstrates how to create interactive Venn diagrams with toggleable shaded regions. The core mathematical concept involves set theory, covering intersection, union, and complement operations visualized through Venn diagrams, as well as the relationships between sets and logical operations. Construction details: Using the Vertex command to define boundary points of set regions, the Segment command to draw set outlines, combined with buttons (button1-13) to enable dynamic shading switching for different set regions, plus text labels (text1-3) to display set names and operation expressions. This example is suitable for high school and above students learning introductory set theory and probability statistics, as well as math teachers as a visualization teaching tool for set operations, providing an intuitive demonstration of set relationships and logical operations.
GeoGebra Commands & Parameters
Vertex(u) → A, B, C, D, E, FSegment(C, E) → fSegment(E, D) → gSegment(D, B) → hSegment(B, C) → i
AI Drawing Prompt Reference
Create a Venn diagram with two overlapping circular regions, each outlined with bold strokes. Place one vertex inside the left circle, another inside the right circle, and a third in the overlapping area. Add points on the boundary of each circle and connect them with line segments to clearly define the region edges. Below the diagram, include three text labels indicating set names and operation expressions. Ensure the layout is symmetric and lines are distinct for easy visualization of intersection, union, and complement relationships.
The prompt above was compiled from the original drawing commands and is for reference only.