
Shading of Venn Diagrams
Loading the math board and drawing, please wait…
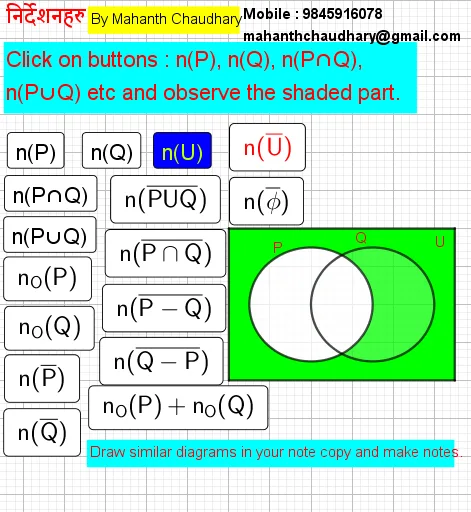
This example demonstrates how to shade Venn diagrams to show the relationships between two sets. Key mathematical concepts include set theory, area calculation, and geometric representation. Construction involves using GeoGebra commands like Vertex and Segment to create set boundaries and shade regions. Suitable for middle school and above, this helps students understand set operations and graphical representation.
GeoGebra Commands & Parameters
Vertex(u) → A, B, C, D, E, FSegment(C, E) → fSegment(E, D) → gSegment(D, B) → hSegment(B, C) → i
AI Drawing Prompt Reference
Create a plane diagram for two sets using shaded regions. First place six key vertices as construction points. Connect the vertices with straight line segments so that they form the outer boundary and an internal divider, using three consecutive segments that start from an intermediate point and run to two other points, continuing to complete the partition. Shade the areas defined by these segments to visually indicate the separate parts of the two sets and their overlap. Keep the relationships exactly as given by the connected vertices and segments.
The prompt above was compiled from the original drawing commands and is for reference only.