
Venn Diagram Shaded Area: Specific Combinations of Sets A and B
Loading the math board and drawing, please wait…
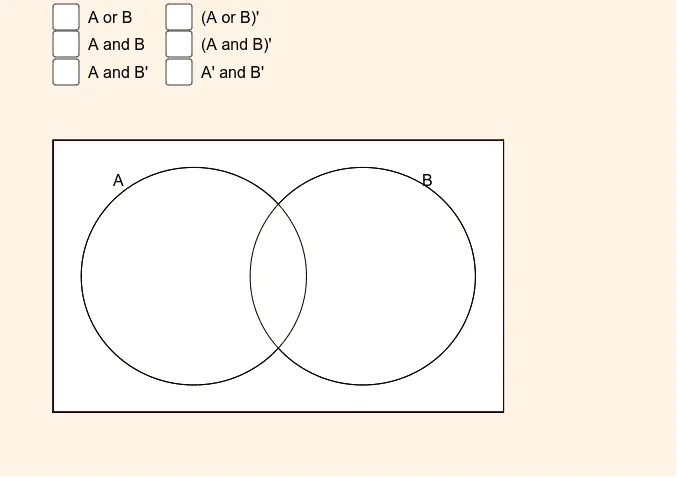
① This example demonstrates how to dynamically draw a Venn diagram in GeoGebra and automatically shade the area corresponding to specific combinations of sets A and B (such as intersection, union, difference, etc.), providing a visual representation of set operations. ② The core mathematical concepts include basic set operations (intersection, union, complement, difference) and the visualization of logical relationships through geometric regions. ③ Construction highlights: From the construction summary, the example uses Polygon (to draw the outer frame), Circle (to represent sets A and B), Intersect (to find boundary points), CircleArc (to create curved boundaries), Point (to mark key locations), and Locus (to generate dynamic shaded regions); objects include poly1, poly2, multiple circles and arcs, and auxiliary points E, F, G, etc., with shading controlled by sliders or conditions. ④ This is suitable for middle school mathematics (sets and logic) teaching, as well as introductory discrete mathematics in college, helping students understand the geometric meaning of set operations and serving as an interactive worksheet for exploring different region combinations.
GeoGebra Commands & Parameters
Polygon(A, B, C, D) → poly1, a, b, c_2, dCircle(E, 2) → eCircle(F, 2) → fIntersect(a, d) → GIntersect(c_2, d) → HPolygon(G, H, I, J) → poly2, g, h, i, jCircle(E, 2) → pCircle(F, 2) → qCircle(E, 2) → rCircle(F, 2) → sIntersect(e, f, 1) → KIntersect(e, f, 2) → LCircleArc(E, L, K) → tCircleArc(F, K, L) → cPoint({c, t}) → Mit1Locus(Mi1, Mit1) → loc1CircleArc(E, K, L) → c_1Point({c_1, c}) → Mit2Locus(Mi2, Mit2) → loc2CircleArc(F, L, K) → d_1Point({d_1, t}) → Mit3Locus(Mi3, Mit3) → loc4Intersect(a, d) → MIntersect(c_2, d) → NPolygon(M, N, O, P) → poly3, m_1, n_1, o_1, p_1Intersect(a, d) → QIntersect(c_2, d) → RIntersect(b, c_2) → SIntersect(a, b) → TPolygon(Q, R, S, T) → poly4, q_1, r_1, s_1, t_1
AI Drawing Prompt Reference
Draw a Venn diagram showing the intersections, unions, and differences of sets A and B. Use a polygon for the outer frame and two circles to represent sets A and B. Determine boundary points through intersections and use arcs and points to mark key locations. Then, generate dynamic shaded regions using these points to display different combinations of the diagram.
The prompt above was compiled from the original drawing commands and is for reference only.