
Distance-Time / Division by Fractions: A Visual Demonstration
Loading the math board and drawing, please wait…
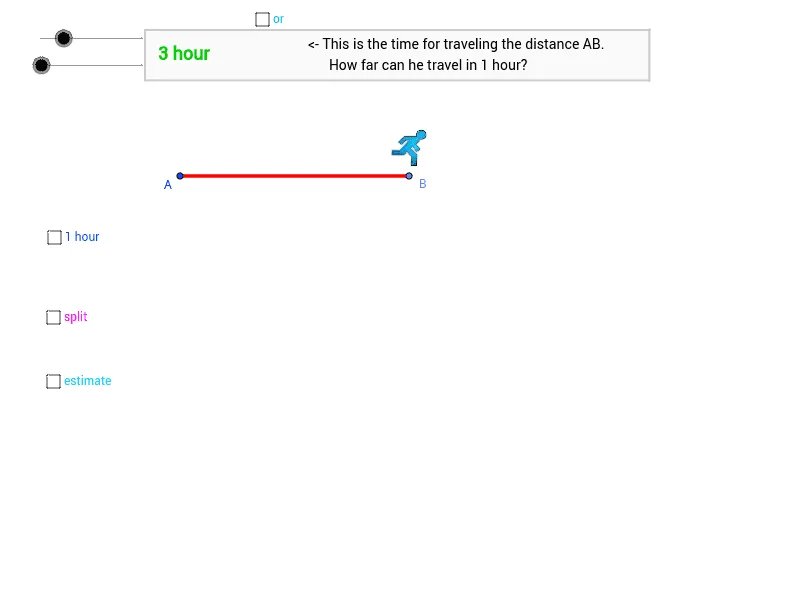
This GeoGebra applet visually demonstrates the relationship between distance-time graphs and division by fractions. The core mathematical concepts include fraction division, proportional reasoning, and the interpretation of slope in distance-time graphs. Construction details: the applet uses commands such as Ray, Point, Segment, Sequence, Line, and Polygon to build geometric objects, along with lists (list1, list2) and text elements (text1, etc.) to display numerical values and explanations. Images (pic1, pic2) are also embedded to support understanding. Suitable for middle school mathematics, this applet helps students grasp the geometric meaning of fraction division and how speed relates to time in distance-time graphs.
GeoGebra Commands & Parameters
Ray(A, B_1) → aPoint(a) → BSegment(A, B) → bSequence(Line[(x(A) + i * (x(B) - x(A)) / n, 0), yAxis], i, 0, 5 * n) → list1Line(A, yAxis) → ePoint(e) → FSegment(F, G) → fSequence(Line[(x(A) + i * (x(B) - x(A)) / nu, 0), yAxis], i, 0, 5 * nu) → list2Point(e) → JRay(J, K) → iPoint(i) → LSegment(J, L) → jPolygon(C, M, N, O) → poly1, c_1, m, n_1, o