
Venn Diagram Example by Dr Brooks (8)
Loading the math board and drawing, please wait…
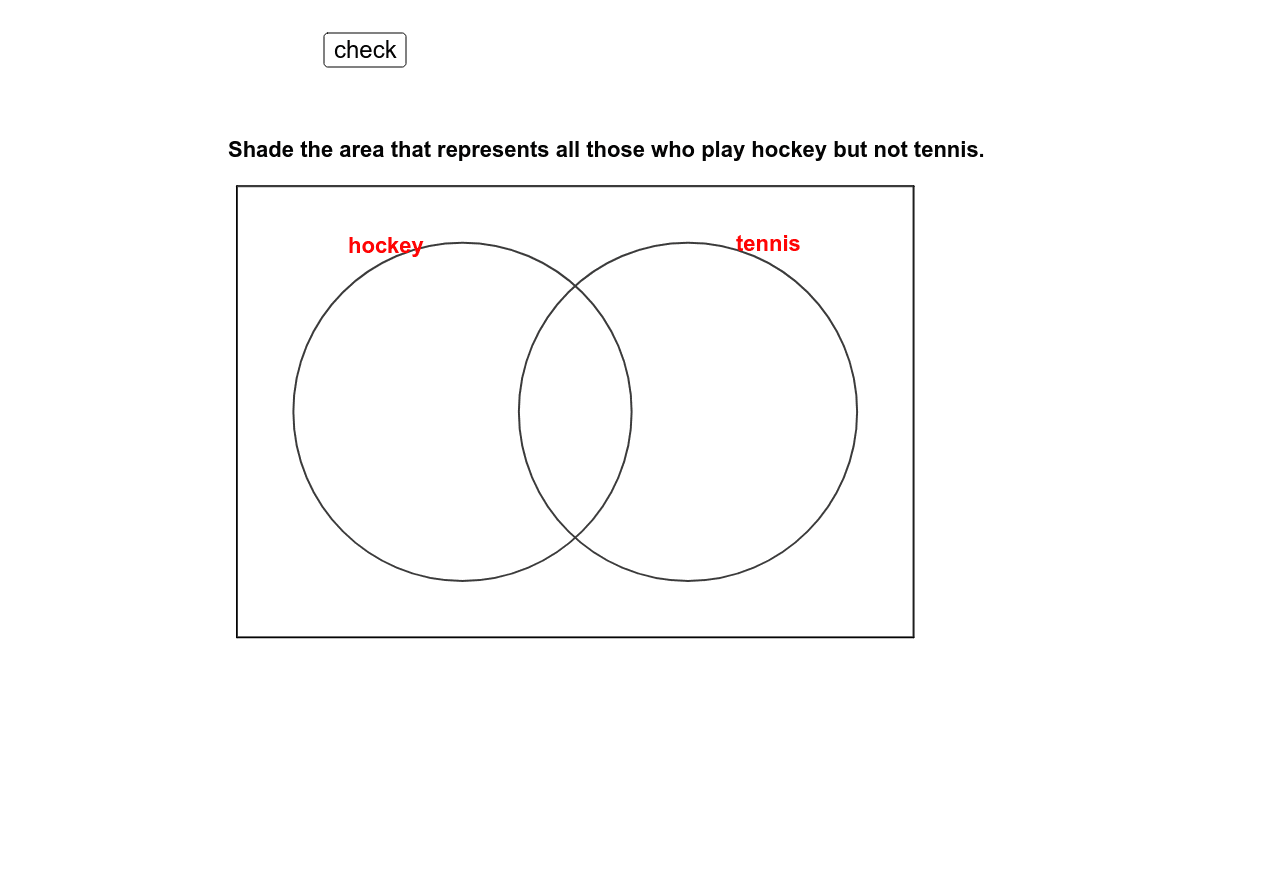
This example uses a Venn diagram to illustrate the relationships between sets. The core mathematical concepts involved are set theory, including intersection, union, and complement. It utilizes commands like Polygon and Point in GeoGebra for construction. Suitable for middle school and above students to learn about set concepts and operations.
GeoGebra Commands & Parameters
Polygon(A, D, C, B) → poly1, a, d, c, bPoint(xAxis) → EPoint(xAxis) → FCircle(E, G) → eCircle(F, H) → fIf(Mod[tagg, 2] ≟ 0, "white", "green") → colgIf(Mod[tagh, 2] ≟ 0, "white", "green") → colhIf(Mod[tagi, 2] ≟ 0, "white", "green") → coliIf(Mod[tagj, 2] ≟ 0, "white", "green") → coljMod(tagg, 2) → tagg2Mod(tagh, 2) → tagh2Mod(tagi, 2) → tagi2Mod(tagj, 2) → tagj2
AI Drawing Prompt Reference
Draw a Venn diagram example: start with a rectangle as the universal set, then place two intersecting circles inside it to represent two sets. The overlapping area shows the intersection, while the non-overlapping parts show unique elements. Mark points as elements inside or outside the circles. Use alternating green and white fills for different regions (overlap and exclusive parts) to illustrate set operations. The layout should clearly show relationships of inclusion, intersection, and complement, suitable for educational demonstration.
The prompt above was compiled from the original drawing commands and is for reference only.