
Venn Diagram Example by Dr Brooks (11)
Loading the math board and drawing, please wait…
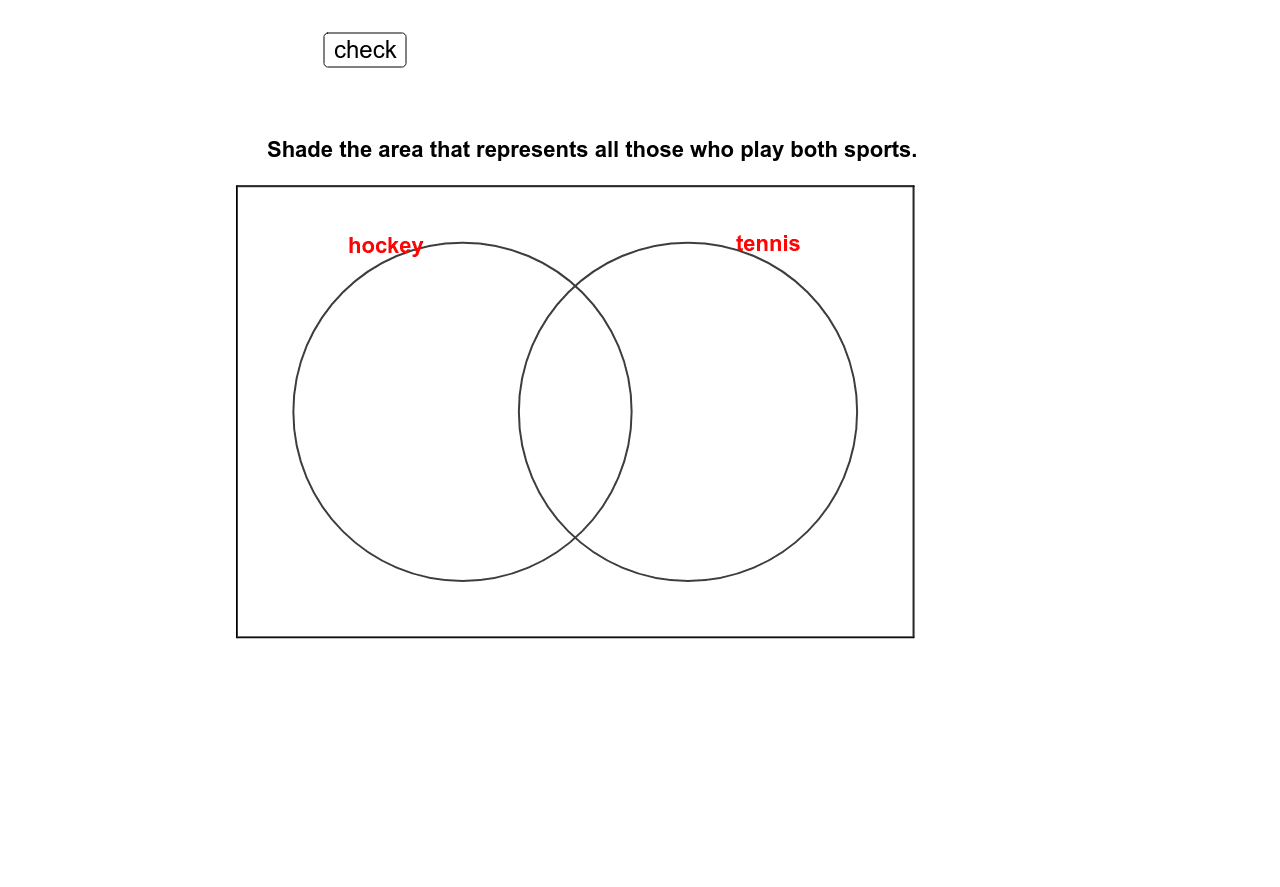
This example demonstrates how to draw a Venn diagram. Venn diagrams are used to show the relationships between sets. Using GeoGebra commands like Polygon, Point, and Circle, it's easy to construct a Venn diagram. Suitable for students at the junior high school level and above for learning set theory.
GeoGebra Commands & Parameters
Polygon(A, D, C, B) → poly1, a, d, c, bPoint(xAxis) → EPoint(xAxis) → FCircle(E, G) → eCircle(F, H) → fIf(Mod[tagg, 2] ≟ 0, "white", "green") → colgIf(Mod[tagh, 2] ≟ 0, "white", "green") → colhIf(Mod[tagi, 2] ≟ 0, "white", "green") → coliIf(Mod[tagj, 2] ≟ 0, "white", "green") → coljMod(tagg, 2) → tagg2Mod(tagh, 2) → tagh2Mod(tagi, 2) → tagi2Mod(tagj, 2) → tagj2
AI Drawing Prompt Reference
Draw a Venn diagram with two intersecting circles. First, draw two circles with centers at points E and F on the x-axis, then fill the circles with either white or green, depending on their position.
The prompt above was compiled from the original drawing commands and is for reference only.