
Venn Diagram Example by Alexander Blanksby
Loading the math board and drawing, please wait…
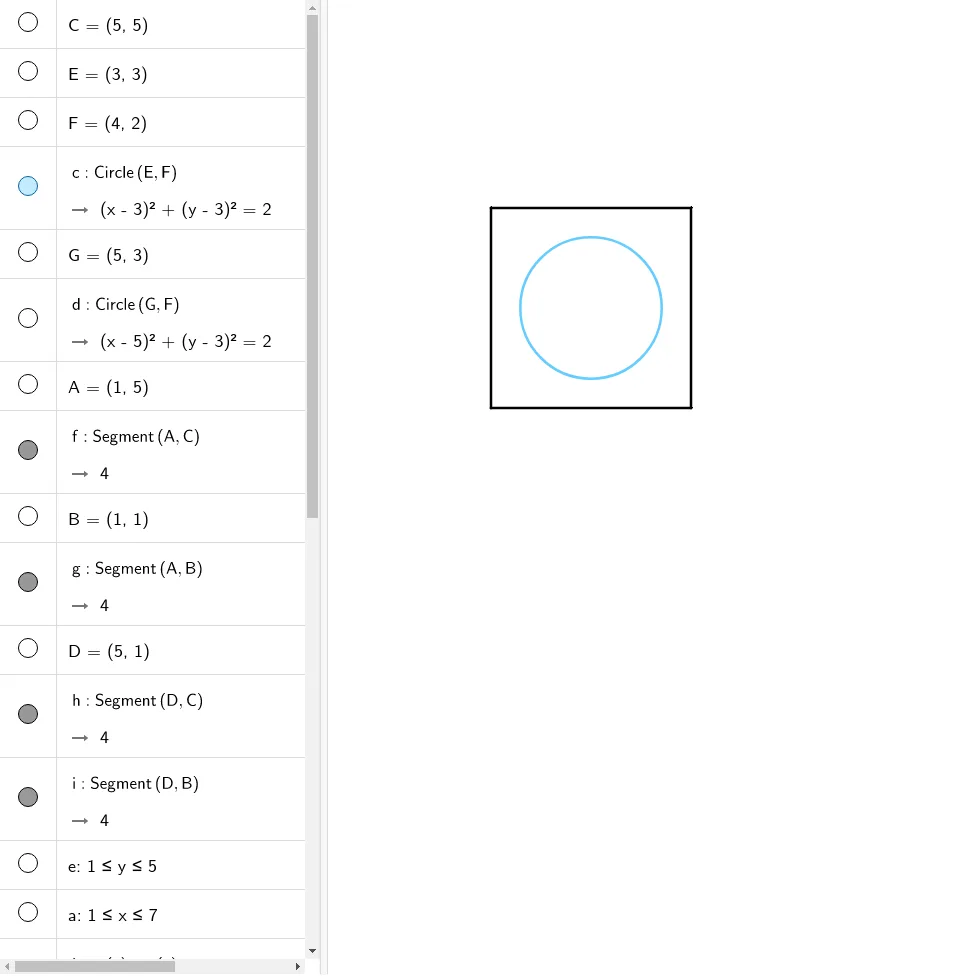
This example demonstrates how to use Venn diagrams to represent relationships between sets. Core math concepts include set theory, logical operations, and probability & statistics. Construction highlights: utilized GeoGebra commands/objects like Circle and Segment. Suitable for high school mathematics, logical thinking training, and set relationship visualization in teaching.
GeoGebra Commands & Parameters
Circle(E, F) → cCircle(G, F) → dSegment(A, C) → fSegment(A, B) → gSegment(D, C) → hSegment(D, B) → iCircle(H, sqrt(2)) → r