
Dot Plot: How a Data Value Affects Statistics 1
Loading the math board and drawing, please wait…
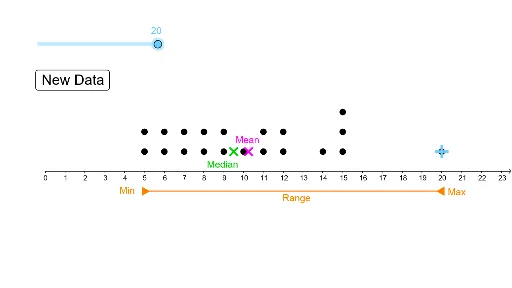
This interactive GeoGebra example demonstrates how changing a single data value in a dot plot influences key statistics such as the mean, median, and standard deviation. It visualizes frequency distribution and the concepts of central tendency (median) and dispersion (standard deviation). The construction uses the DotPlot command to create the dot plot, Random to generate data points, and Segment for auxiliary lines. Objects include multiple data points (A1–A20), a button (button1), and auxiliary points (A–J) along with functions (f, g, h, i). Users can interactively adjust a data value via sliders or buttons to see real-time updates in statistics. This is ideal for middle or high school statistics lessons, helping students grasp how outliers or data changes affect summary measures.
GeoGebra Commands & Parameters
DotPlot(A1:A20) → l1Random(5, 15) → A2Random(5, 15) → A3Random(5, 15) → A4Random(5, 15) → A5Random(5, 15) → A6Random(5, 15) → A7Random(5, 15) → A8Random(5, 15) → A9Random(5, 15) → A10Random(5, 15) → A11Random(5, 15) → A12Random(5, 15) → A13Random(5, 15) → A14Random(5, 15) → A15Random(5, 15) → A16Random(5, 15) → A17Random(5, 15) → A18Random(5, 15) → A19Random(5, 15) → A20Segment(E, D) → fSegment(F, G) → gstdev(A1:A20) → bSegment(I, J) → hSegment(J, H) → i