
Dot Plot - How a Data Value Affects Statistics
Loading the math board and drawing, please wait…
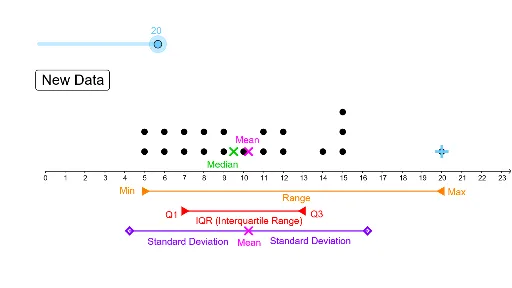
This example demonstrates how a dot plot visually represents data point distribution and its impact on statistics like mean and standard deviation. It involves core concepts in probability & statistics. Construction uses commands like DotPlot, Random, Segment, and stdev. Ideal for high school students and math enthusiasts learning data analysis and statistical visualization.
GeoGebra Commands & Parameters
DotPlot(A1:A20) → l1Random(5, 15) → A2Random(5, 15) → A3Random(5, 15) → A4Random(5, 15) → A5Random(5, 15) → A6Random(5, 15) → A7Random(5, 15) → A8Random(5, 15) → A9Random(5, 15) → A10Random(5, 15) → A11Random(5, 15) → A12Random(5, 15) → A13Random(5, 15) → A14Random(5, 15) → A15Random(5, 15) → A16Random(5, 15) → A17Random(5, 15) → A18Random(5, 15) → A19Random(5, 15) → A20Segment(E, D) → fSegment(F, G) → gstdev(A1:A20) → bSegment(I, J) → hSegment(J, H) → i
AI Drawing Prompt Reference
Create a dot plot to visualize the distribution of 15 randomly generated data points ranging from 5 to 15. Connect these points with line segments to form the plot. Calculate and display the standard deviation of the data points, and draw a line segment representing the mean. Finally, use two additional line segments to connect the sides of the plot, highlighting the range and central tendency of the data distribution.
The prompt above was compiled from the original drawing commands and is for reference only.