
Dot Plot - Data Value Impact on Statistics
Loading the math board and drawing, please wait…
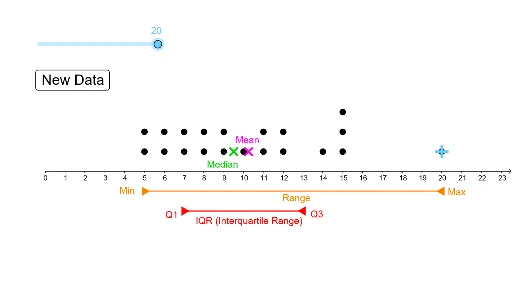
This example demonstrates how a dot plot visually represents data point distribution and its effect on statistical measures like standard deviation. Core concepts include data distribution, standard deviation calculation, random number generation, line segment construction, and geometric relationships involving triangles and circumcircles. Constructed using GeoGebra commands such as DotPlot for plotting, Random for data generation, Segment for line drawing, and stdev for standard deviation. Suitable for high school mathematics education, illustrating the application of statistics and geometry.
GeoGebra Commands & Parameters
DotPlot(A1:A20) → l1Random(5, 15) → A2Random(5, 15) → A3Random(5, 15) → A4Random(5, 15) → A5Random(5, 15) → A6Random(5, 15) → A7Random(5, 15) → A8Random(5, 15) → A9Random(5, 15) → A10Random(5, 15) → A11Random(5, 15) → A12Random(5, 15) → A13Random(5, 15) → A14Random(5, 15) → A15Random(5, 15) → A16Random(5, 15) → A17Random(5, 15) → A18Random(5, 15) → A19Random(5, 15) → A20Segment(E, D) → fSegment(F, G) → gstdev(A1:A20) → bSegment(I, J) → hSegment(J, H) → i