
Venn Diagram Construction by Dr Brooks
Loading the math board and drawing, please wait…
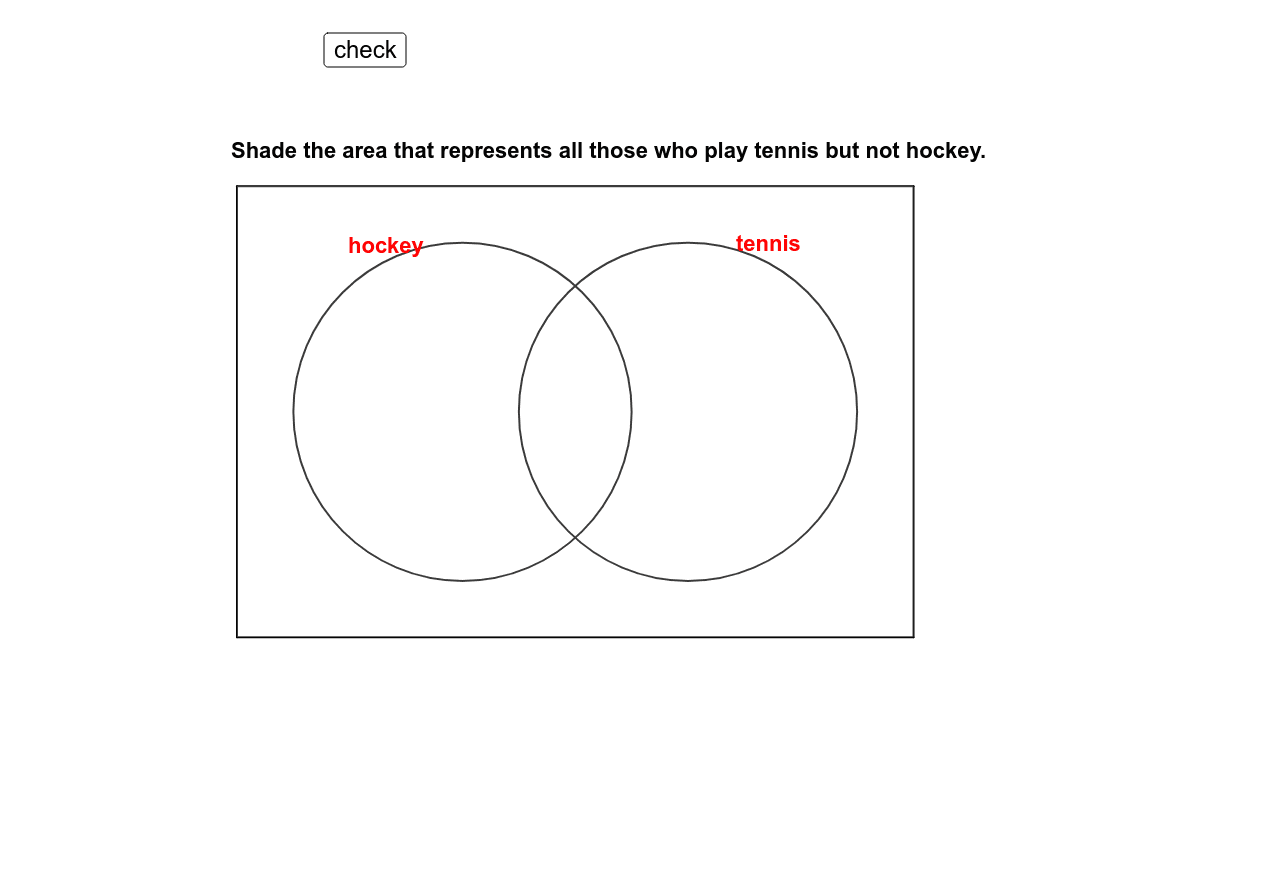
This example demonstrates how to construct a Venn diagram using GeoGebra. Key mathematical concepts include set theory, specifically intersections, unions, and complements. Construction highlights include using the Polygon command to draw regions, the Point command to add points, and the If command for conditional judgments. Suitable for middle school and above students to learn about set operations.
GeoGebra Commands & Parameters
Polygon(A, D, C, B) → poly1, a, d, c, bPoint(xAxis) → EPoint(xAxis) → FCircle(E, G) → eCircle(F, H) → fIf(Mod[tagg, 2] ≟ 0, "white", "green") → colgIf(Mod[tagh, 2] ≟ 0, "white", "green") → colhIf(Mod[tagi, 2] ≟ 0, "white", "green") → coliIf(Mod[tagj, 2] ≟ 0, "white", "green") → coljMod(tagg, 2) → tagg2Mod(tagh, 2) → tagh2Mod(tagi, 2) → tagi2Mod(tagj, 2) → tagj2
AI Drawing Prompt Reference
Draw a Venn diagram with three overlapping circles. Each circle represents a set, the overlapping area represents the intersection of sets, and the union of the circles represents the union of sets. Ensure the boundaries of the circles are clear and the internal regions are distinguished by different colors. Construct by first drawing the three circles, then determining the intersection area, and finally labeling the set relationships.
The prompt above was compiled from the original drawing commands and is for reference only.