
Venn Diagram and Probability Statistics
Loading the math board and drawing, please wait…
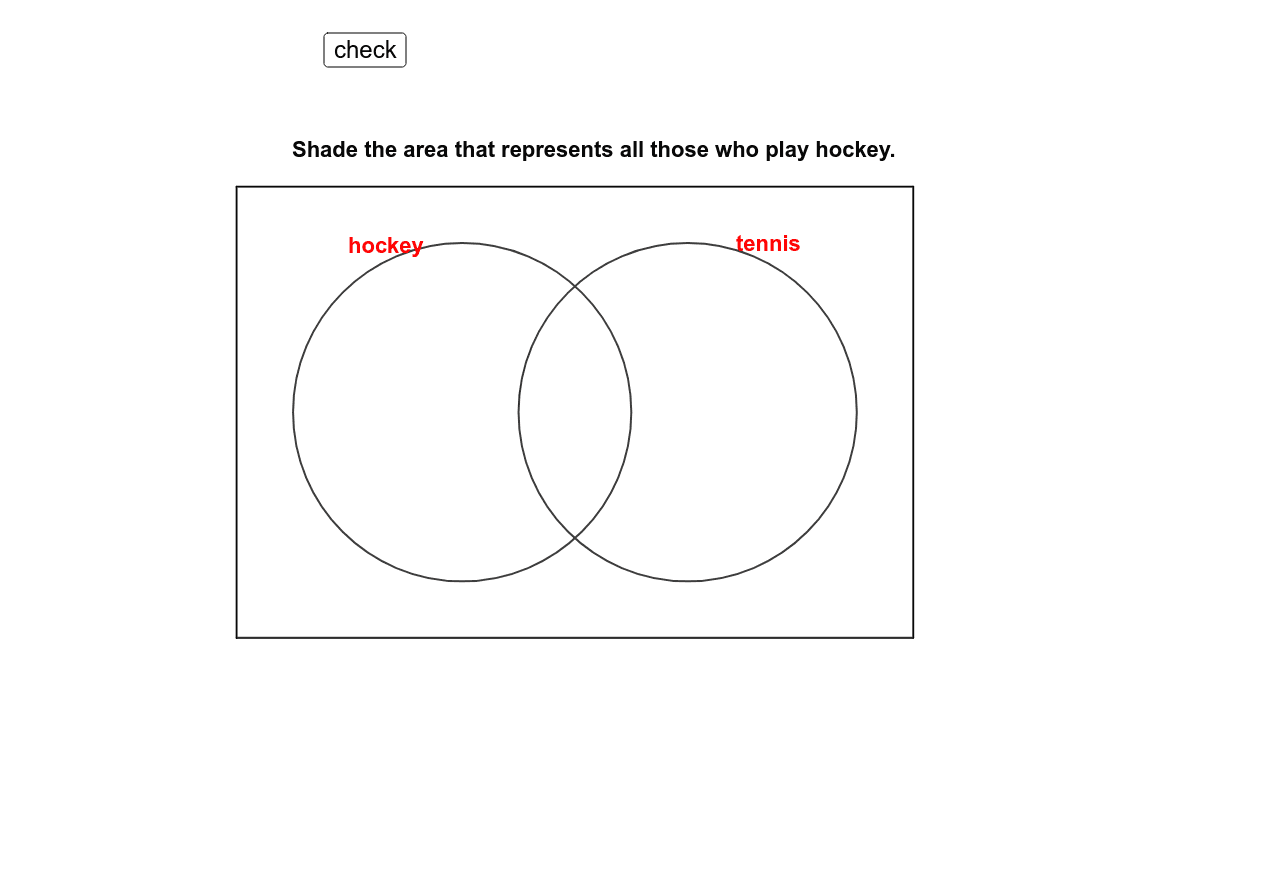
This example demonstrates the application of Venn diagrams in probability statistics, highlighting concepts of set intersections and unions. Key mathematical concepts include set theory, probability calculations, and geometric construction. The construction involves using GeoGebra commands like Polygon, Circle, and If to create Venn diagrams, with a slider for dynamic adjustments. Suitable for high school students learning set theory and probability, or as a beginner's exercise in mathematical modeling.
GeoGebra Commands & Parameters
Polygon(A, D, C, B) → poly1, a, d, c, bPoint(xAxis) → EPoint(xAxis) → FCircle(E, G) → eCircle(F, H) → fIf(Mod[tagg, 2] ≟ 0, "white", "green") → colgIf(Mod[tagh, 2] ≟ 0, "white", "green") → colhIf(Mod[tagi, 2] ≟ 0, "white", "green") → coliIf(Mod[tagj, 2] ≟ 0, "white", "green") → coljMod(tagg, 2) → tagg2Mod(tagh, 2) → tagh2Mod(tagi, 2) → tagi2Mod(tagj, 2) → tagj2
AI Drawing Prompt Reference
Draw a Venn diagram with two intersecting circles, where the intersection and union areas are dynamically adjustable using a slider, and the sets are displayed in different colors to show their states, illustrating concepts of set intersections and unions for students learning probability statistics and set theory.
The prompt above was compiled from the original drawing commands and is for reference only.