
Velocity, Position, and Acceleration vs. Time Graphs by Saumya Patel
Loading the math board and drawing, please wait…
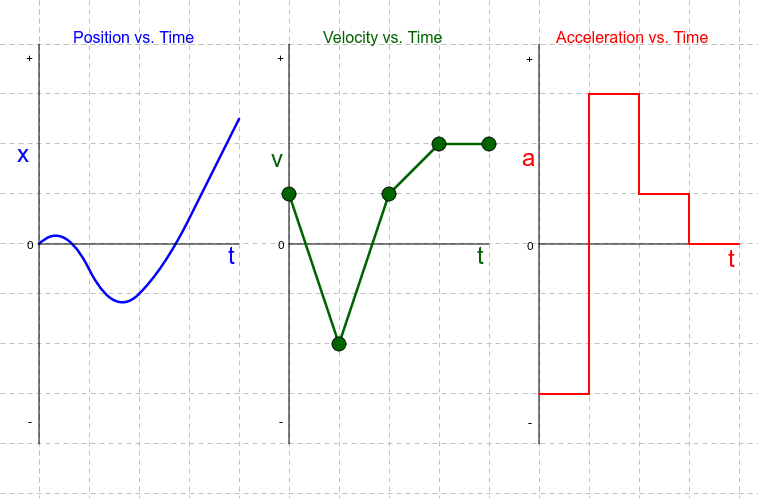
This example demonstrates how adjusting the shape of a Velocity vs. Time graph affects corresponding Position vs. Time and Acceleration vs. Time graphs. Key math concepts include function graphing, kinematics, derivatives, and integrals. Constructed using GeoGebra commands like Segment, Midpoint, and Point, with Slider animations to manipulate points dynamically. Ideal for high school physics and mathematics education to explore motion relationships and calculus applications.
GeoGebra Commands & Parameters
Segment((9, -4), (9, 4)) → m5Segment((8, -4), (8, 4)) → m4Segment((7, -4), (7, 4)) → m3Segment((6, -4), (6, 4)) → m2Segment((5, -4), (5, 4)) → m1Segment(A, B) → a_3Midpoint(a_3) → DSegment(D, C) → bSegment(A_1, B_1) → a_1Midpoint(a_1) → D_1Segment(D_1, C_1) → b_1Segment(A_2, B_2) → a_2Midpoint(a_2) → D_2Segment(D_2, C_2) → b_2Point(m1) → EPoint(m2) → FSegment(E, F) → aPoint(m3) → GSegment(F, G) → cPoint(m4) → HSegment(G, H) → dPoint(m5) → ISegment(H, I) → eSegment(J, K) → fSegment(K, L) → gSegment(L, M) → hSegment(M, N) → iSegment(N, O) → jSegment(O, P) → kSegment(P, Q) → l