
Venn Diagram for Set Theory with Movable Letters and Numbers
Loading the math board and drawing, please wait…
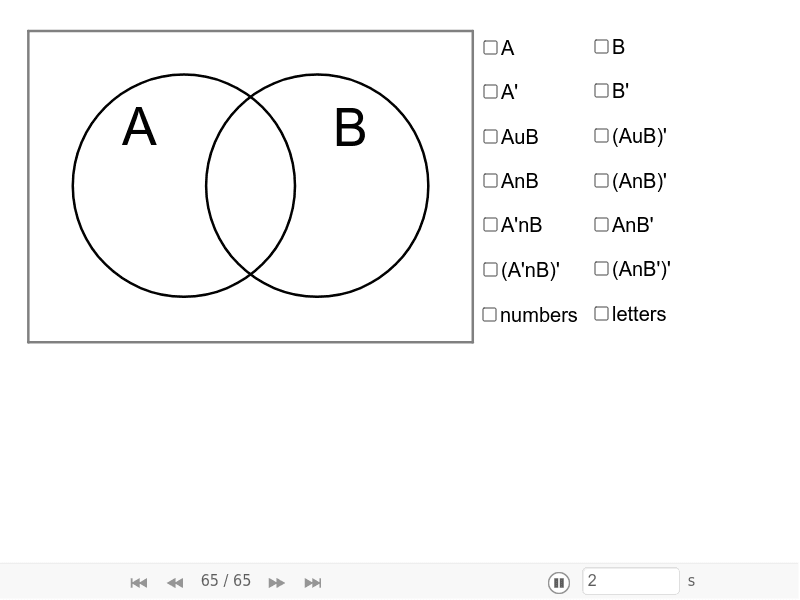
This example demonstrates a Venn diagram with movable letters and numbers to show the value of each set in set theory. Key mathematical concepts include sets, intersections, and unions. Using GeoGebra commands such as Point, Circle, and Polygon, a dynamic Venn diagram is constructed. Suitable for students in middle school and above learning set theory.
GeoGebra Commands & Parameters
Point(yAxis) → ACircle(A, 5) → AboldPoint(xAxis) → BCircle(B, 5) → BboldPolygon(C, D, E, F) → Ubold, c_1, d_1, e, fIntersect(Abold, Bbold, 1) → GIntersect(Abold, Bbold, 2) → HCircleArc(A, G, H) → AarcCircleArc(B, G, H) → AsarcCircleArc(A, H, G) → BsarcCircleArc(B, H, G) → BarcCircle(A, 5) → AshadeCircle(B, 5) → BshadePolygon(C, D, E, F) → Ushade, K_2, K_3, K_4, K_5Circle(A, 5) → AwhiteCircle(B, 5) → BwhiteCircleArc(B, G, H) → AsarcwhiteCircleArc(A, H, G) → BsarcwhiteCircleArc(A, H, G) → BsarcxCircleArc(B, G, H) → Asarcx
AI Drawing Prompt Reference
Draw a Venn diagram with two circles representing sets A and B, which have an intersection. Place a movable number or letter in the intersection area to show its value. Also place movable numbers or letters in the non-intersection parts of each circle to show the values of each set. Finally, use shading to distinguish the intersection and non-intersection parts of the circles.
The prompt above was compiled from the original drawing commands and is for reference only.