
Vector Addition Example by Walch Education (2)
Loading the math board and drawing, please wait…
In collections
UCSS Secondary Math I Unit 6 Lesson 3
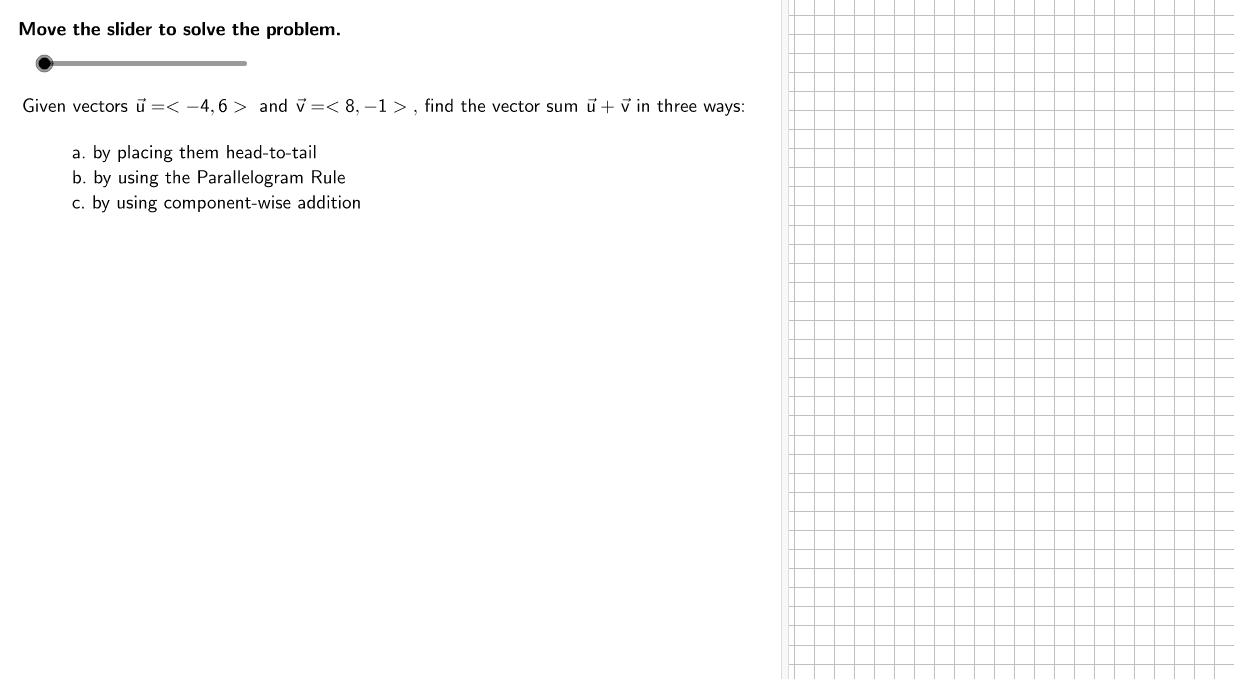
This example demonstrates how to use GeoGebra to graph two vectors and calculate their sum. The core mathematical concept involved is vector addition, represented through the parallelogram or triangle rule. Key construction steps include using commands like Segment, Vector, and TableText to create vectors, and employing objects such as Formula2a, Formula2b, and Formula2c for calculations and labeling. Suitable for high school mathematics students learning vector operations.
GeoGebra Commands & Parameters
Segment(v1T + (0, (-0.5)), v2T + (0, (-0.5))) → b1Segment(P0 - (0.5, 0), v1T - (0.5, 0)) → a1Segment(P0, SumCorner) → aSegment(SumCorner, vsT) → bVector(((ShiftFactor * u1), (ShiftFactor * u2)), ((ShiftFactor * u1), (ShiftFactor * u2)) + (v1, v2)) → v1movedVector(v1T, vsT) → uMVector(v2T, vsT) → vMTableText({{Formula2a, "\textsf{Write the vectors being added in component form.}"}, {Formula2b, "\textsf{Component-wise addition formula}"}, {Formula2c, "\textsf{Substitute.}"}, {Formula2d, " \textsf{Simplify.}"}}, "l") → work5
AI Drawing Prompt Reference
Draw two vectors and show their sum using the parallelogram or triangle rule. First, plot the starting and ending points of the two vectors. Then, connect the starting points and ending points with line segments to form a parallelogram. Next, draw a vector from the starting point to the opposite corner of the parallelogram to represent the sum of the two vectors. Finally, add text labels next to the diagram to explain the component form of the vectors, the addition formula, and the calculation steps.
The prompt above was compiled from the original drawing commands and is for reference only.