
Using Table to Find Probability
Loading the math board and drawing, please wait…
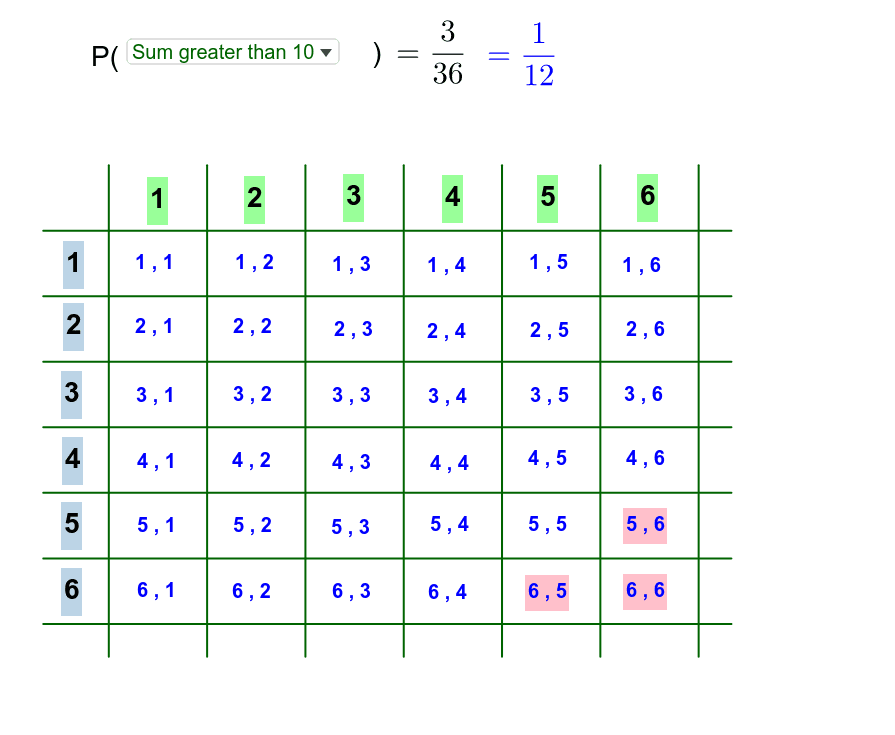
This GeoGebra example demonstrates how to use an interactive table to find probabilities, visually linking random experiments with frequency-based probability estimation. The core mathematical concepts include probability and statistics, random experiments, correlation, exponent functions, and optimization problems. The construction uses GeoGebra commands such as Segment and SelectedIndex, creating multiple triangle objects (TR1-TR6, TC1-TC6) and numerous points, functions, and segments (A, B, f, C, D, g, etc.) to build a dynamic table linked with geometric representations. It is suitable for middle school to high school probability lessons, as well as introductory college statistics, helping learners grasp how to organize data in tables, compute relative frequencies, and approximate probabilities while enhancing intuition through geometric visualization.
GeoGebra Commands & Parameters
Segment(A, B) → fSegment(C, D) → gSegment(E, F) → hSegment(G, H) → iSegment(I, J) → jSegment(K, L) → kSegment(M, N) → lSegment(O, P) → mSegment(Q, R) → nSegment(S, T) → pSegment(U, V) → qSegment(W, Z) → rSegment(A_1, B_1) → sSegment(C_1, D_1) → tSelectedIndex(list1) → kk
AI Drawing Prompt Reference
Create a dynamic table linked with geometric shapes, including multiple triangles and points, to demonstrate the connection between random experiments and frequency-based probability. The table should show various segments and functions, suitable for probability and statistics education, helping learners understand data organization, relative frequency calculation, and geometric visualization.
The prompt above was compiled from the original drawing commands and is for reference only.