
Using Cylinders to Show Volume of Revolution by Richard Miles
Loading the math board and drawing, please wait…
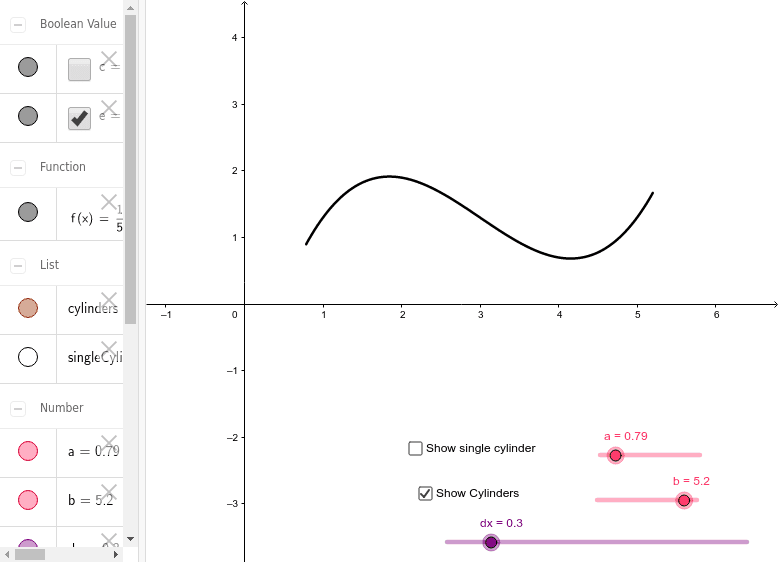
This example dynamically demonstrates how rotating cylinders form volumes of revolution, visually illustrating the concept of integration. Core math concepts include integral calculus, solid geometry, and function graphing. Construction highlights the use of GeoGebra commands like Function, Div, Sequence, and objects such as a, b, r, x_0, dx, D, f, E, r_1, singleCylinder, c, e, nsteps, cylinders. Suitable for high school and above students learning calculus and solid geometry, helping to understand the principles of volume calculation for rotational solids.
GeoGebra Commands & Parameters
Function((((1 / 5 * (x - 1)) * (x - 3)) * (x - 5)) + 1.3, a, b) → fDiv(b - a, dx) → nstepsSequence({QuadricSide[Cylinder[(a + (dx * k), 0), (a + (dx * (k + 1)), 0), f(a + (dx * k))]], Top[Cylinder[(a + (dx * k), 0), (a + (dx * (k + 1)), 0), f(a + (dx * k))]], Bottom[Cylinder[(a + (dx * k), 0), (a + (dx * (k + 1)), 0), f(a + (dx * k))]]}, k, a, (b - a) / dx - 1) → cylinders
AI Drawing Prompt Reference
Draw a function graph and rotate it to form a volume of revolution, demonstrating the concept of integration through cylinders. The cylinders start from the bottom of the function graph and grow in height as the function rises, forming a solid shape. The number and position of cylinders are controlled by dividing the interval, with each cylinder's height corresponding to the function's value in that segment. The overall effect shows the solid formed by rotating the function graph, illustrating the relationship between integration and volume calculation.
The prompt above was compiled from the original drawing commands and is for reference only.