
Unit Circle & Sine Wave
Loading the math board and drawing, please wait…
In collections
Trig Graphs
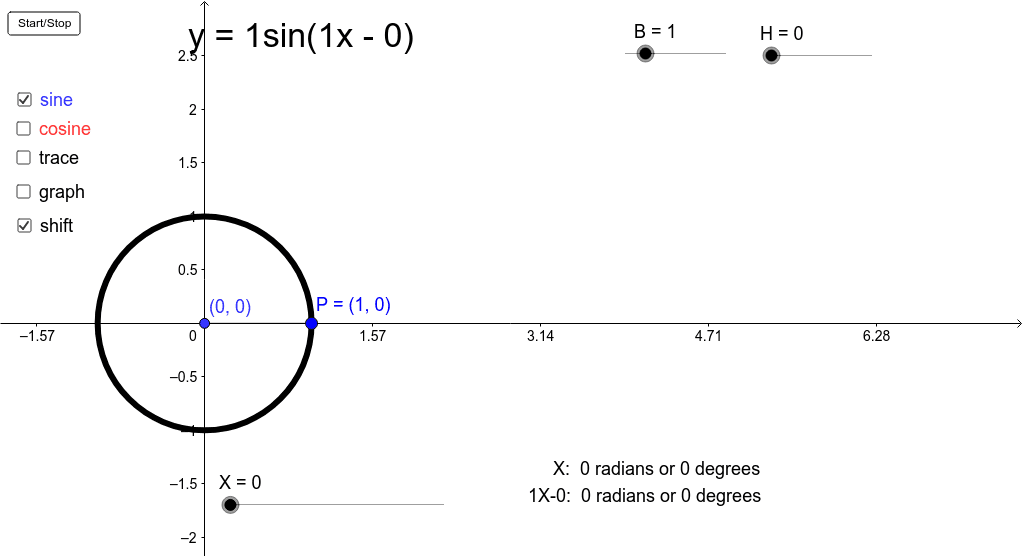
This example demonstrates how a sine wave develops as a point rotates around a unit circle. It involves core math concepts like the unit circle, trigonometric functions, sine function, frequency, and phase shift. Constructed using commands like Segment, Angle, Arc, Function; suitable for high school mathematics or understanding the generation of trigonometric function graphs.
GeoGebra Commands & Parameters
Segment((0, 0), P) → aSegment(P, (x(P), 0)) → sinCircleAngle(xAxis, a) → βSegment((0, 0), Q) → bSegment((0, 0), (x(P), 0)) → cosCircleSegment(Q, (X, x(P))) → cosWaveSegment(Q, sinPoint) → sinWaveSegment(P, (x(P), 0)) → sinCircle2Arc(c, ((A^(2))^(0.5), 0), P) → dFunction(A * sin(B * x - H) + K, 0, 6.28) → sineFunction(A * cos(B * x - H) + K, 0, 6.28) → cosine
AI Drawing Prompt Reference
Draw a unit circle centered at the origin with a point P on its circumference. Draw line segments from P to the x-axis and y-axis, labeled a and sinCircle respectively. Mark the horizontal coordinate of P and draw a line segment cosCircle from this point to the origin. Connect the origin and point P with line segments b and cosWave, linking point Q to sinPoint. Draw another line segment sinCircle2 connecting P to the horizontal coordinate. Finally, sketch an arc on the unit circle and plot two function curves representing the sine and cosine functions.
The prompt above was compiled from the original drawing commands and is for reference only.