
Unit Circle and Tangent Graph by Paul Sutton
Loading the math board and drawing, please wait…
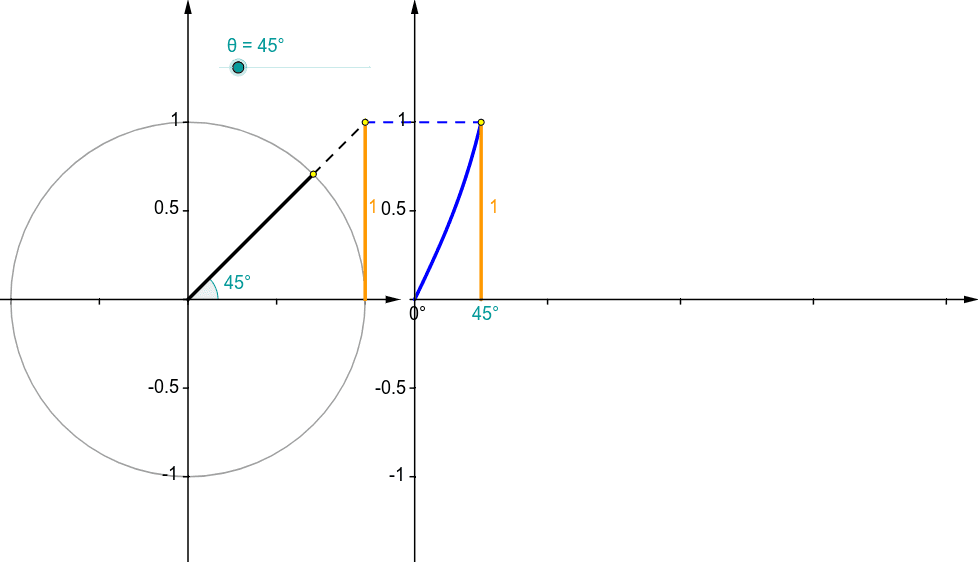
This example demonstrates how to generate the tangent function graph using the unit circle. Core math concepts include the unit circle, trigonometric functions, angles, and function graphs. Construction highlights the use of GeoGebra commands and objects like Point, Rotate, Segment, Angle, Circle, Vector, Sequence, and Function. Suitable for high school mathematics teaching and learning about the relationship between trigonometric functions and function graphs.
GeoGebra Commands & Parameters
Point(Ray[(0, 0), (-1, 0)]) → BRotate(A, θ, B) → PSegment(A, Intersect[Line[B, P], x = x(A)]) → hSegment(P, Intersect[Line[B, P], x = x(A)]) → gRotate(A, θ, B) → A'Angle(A, B, A') → αRotate(A, θ, B) → A'_1Angle(A, B, A'_1) → βSegment(Q, (x(Q), 0)) → eCircle(B, A) → cSegment(B, P) → aVector((x(B), y(Corner[1])), (x(B), y(Corner[4]))) → uVector((0, y(Corner[1])), (0, y(Corner[4]))) → wVector((0, 0), (x(Corner[2]), 0)) → zSequence(Segment[(0.75 * i, 0), (0.75 * i, -0.025)], i, 1, 4) → list1Vector(B - (1.2, 0), B + (1.2, 0)) → vSequence(Segment[(0, 0.5 * i - 1), (-0.025, 0.5 * i - 1)], i, 0, 4) → list2Sequence(Segment[(x(B), 0.5 * i - 1), (x(B) - 0.025, 0.5 * i - 1)], i, 0, 4) → list3Sequence(Segment[B + (0.5 * i - 1, 0), B + (0.5 * i - 1, -0.025)], i, 0, 4) → list4Segment(C, Q) → dFunction(tan(120° * x), 0, θ / (360 * γ) * 3) → fPoint(Ray[(0, 0), (-1, 0)]) → B_1Rotate(A_1, θ, B_1) → P_1Rotate(A_1, θ, B_1) → A'_2Rotate(A_1, θ, B_1) → A'_3Circle(B_1, A_1) → c_1
AI Drawing Prompt Reference
Draw a unit circle and demonstrate how to generate the tangent function graph using it. Start by drawing a ray from the origin to a point on the negative x-axis, then rotate this ray around the origin to create several points. Connect each point to the origin to form line segments, which intersect the x-axis at specific points to create vertical line segments. Through rotation and angle measurement, construct geometric relationships related to the tangent function. Finally, plot the tangent function graph and show its connection to the unit circle.
The prompt above was compiled from the original drawing commands and is for reference only.