
Unit Circle and Cosine Graph by Paul Sutton
Loading the math board and drawing, please wait…
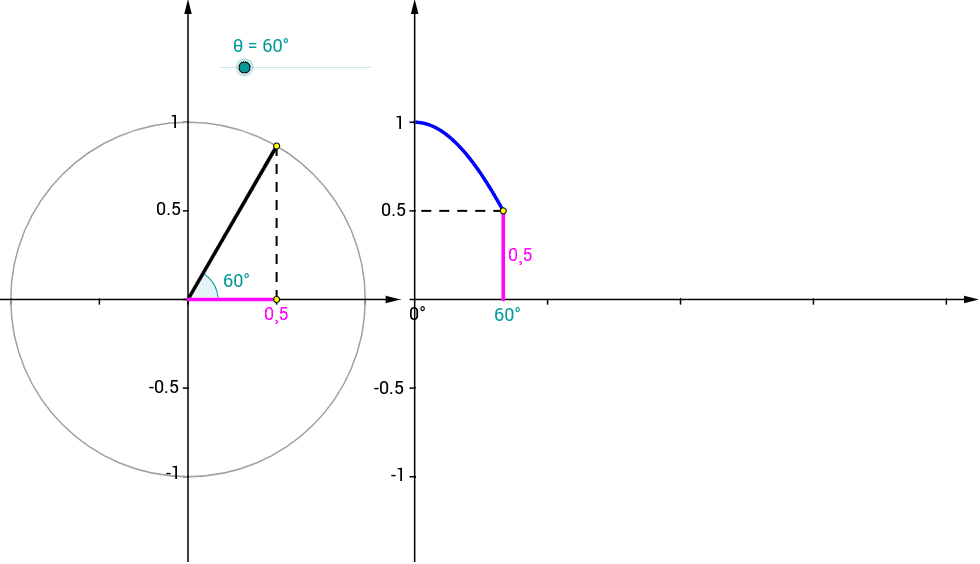
This example demonstrates how to generate the cosine graph using the unit circle. ① It shows how the x-coordinate of point P on the unit circle corresponds to the value of the cosine function; ② Key math concepts include the unit circle, trigonometric functions, coordinate system, and function graphs; ③ Construction highlights the use of GeoGebra commands such as Point, Rotate, Angle, Segment, Circle, Vector, Sequence, and Function; ④ Suitable for high school mathematics education, helping students understand the generation process of trigonometric function graphs.
GeoGebra Commands & Parameters
Point(Ray[(0, 0), (-1, 0)]) → BRotate(A, θ, B) → PRotate(A, θ, B) → A'Angle(A, B, A') → αRotate(A, θ, B) → A'_1Angle(A, B, A'_1) → βSegment(Q, (x(Q), 0)) → eSegment((0, 0), (x(Q), 0)) → gCircle(B, A) → cSegment(B, P) → aVector((x(B), y(Corner[1])), (x(B), y(Corner[4]))) → uVector((0, y(Corner[1])), (0, y(Corner[4]))) → wVector((0, 0), (x(Corner[2]), 0)) → zSequence(Segment[(0.75 * i, 0), (0.75 * i, -0.025)], i, 1, 4) → list1Segment(B, (x(P), 0)) → bSegment(P, (x(P), 0)) → hFunction(cos(120° * x), 0, x(Q)) → fVector(B - (1.2, 0), B + (1.2, 0)) → vSequence(Segment[(0, 0.5 * i - 1), (-0.025, 0.5 * i - 1)], i, 0, 4) → list2Sequence(Segment[(x(B), 0.5 * i - 1), (x(B) - 0.025, 0.5 * i - 1)], i, 0, 4) → list3Sequence(Segment[B + (0.5 * i - 1, 0), B + (0.5 * i - 1, -0.025)], i, 0, 4) → list4Segment(Q, (0, y(Q))) → dPoint(Ray[(0, 0), (-1, 0)]) → B_1Rotate(A_1, θ, B_1) → P_1Rotate(A_1, θ, B_1) → A'_2Rotate(A_1, θ, B_1) → A'_3Circle(B_1, A_1) → c_1Segment(B_1, P_1) → a_1
AI Drawing Prompt Reference
Draw a unit circle and a cosine function graph, showing how the x-coordinate of point P on the unit circle corresponds to the cosine function value. Start by drawing the coordinate axes and the unit circle, then demonstrate the generation process of cosine values by rotating point P. Mark point P on the circle and connect it to its projection on the x-axis to show the relationship between its coordinates and the cosine function value. Finally, draw the cosine function graph, ensuring it aligns with the trajectory of point P on the unit circle.
The prompt above was compiled from the original drawing commands and is for reference only.