
Unit Circle and Sine Graph by Warren Pearson
Loading the math board and drawing, please wait…
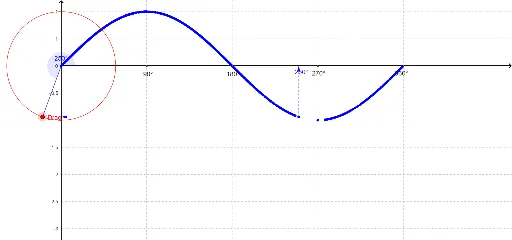
This example demonstrates the relationship between the unit circle and the sine graph by dynamically showing the trajectory of a point moving around the unit circle, generating the sine function graph. Core mathematical concepts include the unit circle, trigonometric functions, sine function, geometric construction, etc. It is constructed using GeoGebra commands/objects such as Intersect (intersection), Point (point), Circle (circle), Segment (segment), Angle (angle), OrthogonalLine (perpendicular line), Vector (vector). Suitable for high school students to learn and understand the generation process of trigonometric function graphs, and can also be used for intuitive display of function graphs in calculus.
GeoGebra Commands & Parameters
Intersect(xAxis, yAxis) → APoint(yAxis) → BCircle(A, B) → cPoint(c) → CSegment(C, A) → aPoint(c) → DAngle(D, A, C) → αOrthogonalLine(E, xAxis) → dOrthogonalLine(E, yAxis) → ePoint(xAxis) → FPoint(xAxis) → GPoint(xAxis) → HIntersect(d, xAxis) → JVector(E, J) → uIntersect(e, yAxis) → KVector(E, K) → v
AI Drawing Prompt Reference
Draw a unit circle and sine function graph. Start by marking the intersection of the x-axis and y-axis as point A, then take point B on the y-axis. Draw a circle c with A and B as its diameter. On circle c, take point C and draw line segment a from C to A. Then take another point D on circle c, and construct angle CAD = α. Draw perpendicular lines d from the x-axis and e from the y-axis, intersecting the x-axis at J and the y-axis at K, respectively. From point E, draw vectors u and v to points J and K, respectively.
The prompt above was compiled from the original drawing commands and is for reference only.