
Union and Intersection of Sets using the Lists Method
Loading the math board and drawing, please wait…
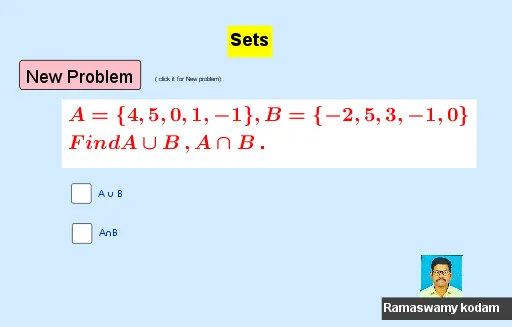
This GeoGebra example demonstrates the union and intersection of sets using the lists method, providing an interactive visualization of fundamental set operations. The core mathematical concepts involved include set theory's union and intersection operations, as well as the use of lists as a data structure to represent and manipulate set elements. In terms of construction, the example employs GeoGebra commands such as Sample for generating random data and Sort for ordering lists, along with objects like A and B representing the input sets, l1 and l2 possibly indicating lists or lines, button1 serving as an interactive control, and text objects (text1 to text6) for displaying results and explanations, with pic1 likely incorporating a diagram. The setup emphasizes how list-based operations can translate into geometric constructions for set outcomes. This example is suitable for high school or introductory college students learning set theory, and it can be used in classroom demonstrations or self-study to enhance understanding of practical set applications.
GeoGebra Commands & Parameters
Sample(Sequence[8] - 3, 5, false) → ASample(Sequence[8] - 3, 5, false) → BSort(Intersection[A, B]) → l1Sort(Union[A, B]) → l2
AI Drawing Prompt Reference
Draw the union and intersection of two sets using the list method, by randomly generating two sets of data and sorting them, represent the intersection and union of the two sets as two lines respectively, use text to display the results and explanations, and finally show the union and intersection of the sets in a diagram.
The prompt above was compiled from the original drawing commands and is for reference only.