
Uniform Distribution Density Function Demo
Loading the math board and drawing, please wait…
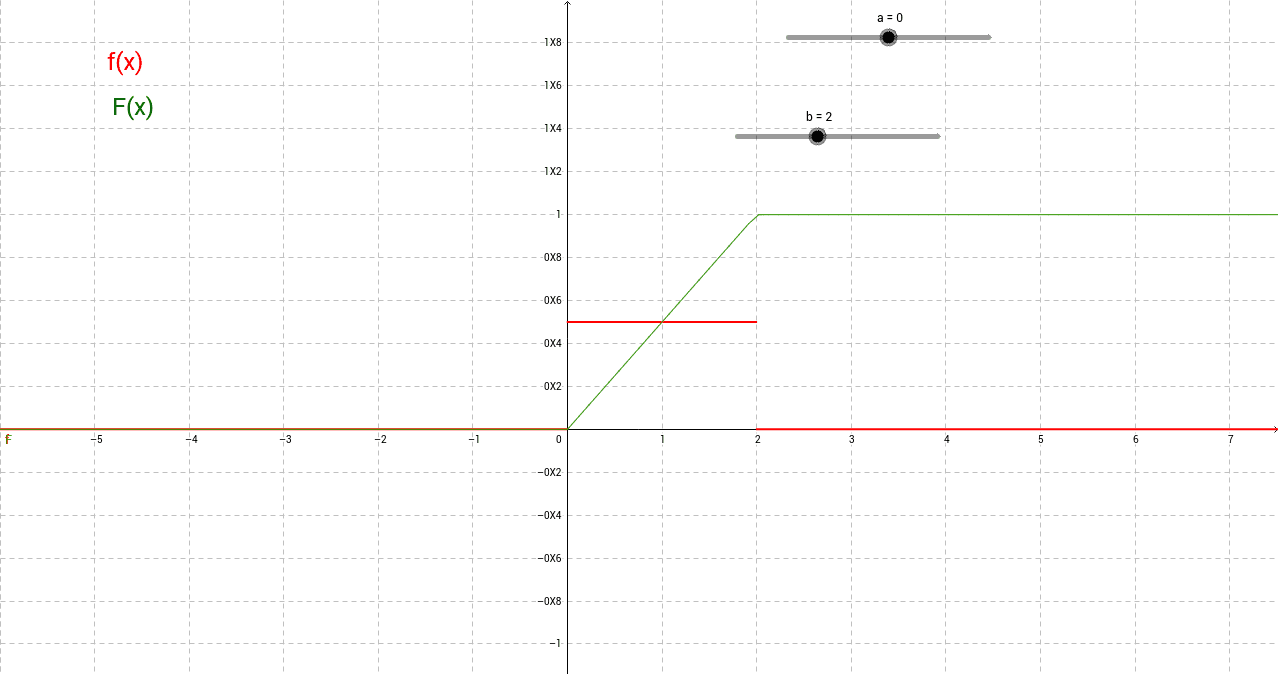
This example demonstrates the graph of the uniform distribution density function and its cumulative distribution function over the interval [a,b]. Key math concepts include probability density function, cumulative distribution function, and interval definition. GeoGebra commands used: a (lower bound), b (upper bound), f (density function), F (cumulative function), texte1 (text annotation), texte2 (text annotation). Suitable for high school students learning probability and statistics to visually understand the properties of the uniform distribution.
GeoGebra Commands & Parameters
Numeric a(0.0)Numeric b(2.0)f(x) = If[a ≤ x ≤ b, 1 / (b - a),0]F(x) = If[x < a, 0,If[a ≤ x ≤ b, (x - a) / (b - a),1]]
AI Drawing Prompt Reference
Draw the probability density function and cumulative distribution function of a uniform distribution over the interval [0,2], where the density function is 1/(b-a) within the interval and 0 outside. The cumulative distribution function starts at 0 at a, ends at 1 at b, and increases linearly within the interval. Include labels for the values of a and b, and the names of the two functions.
The prompt above was compiled from the original drawing commands and is for reference only.