
Exercise 4.13: Range of a Discontinuous Function
Loading the math board and drawing, please wait…
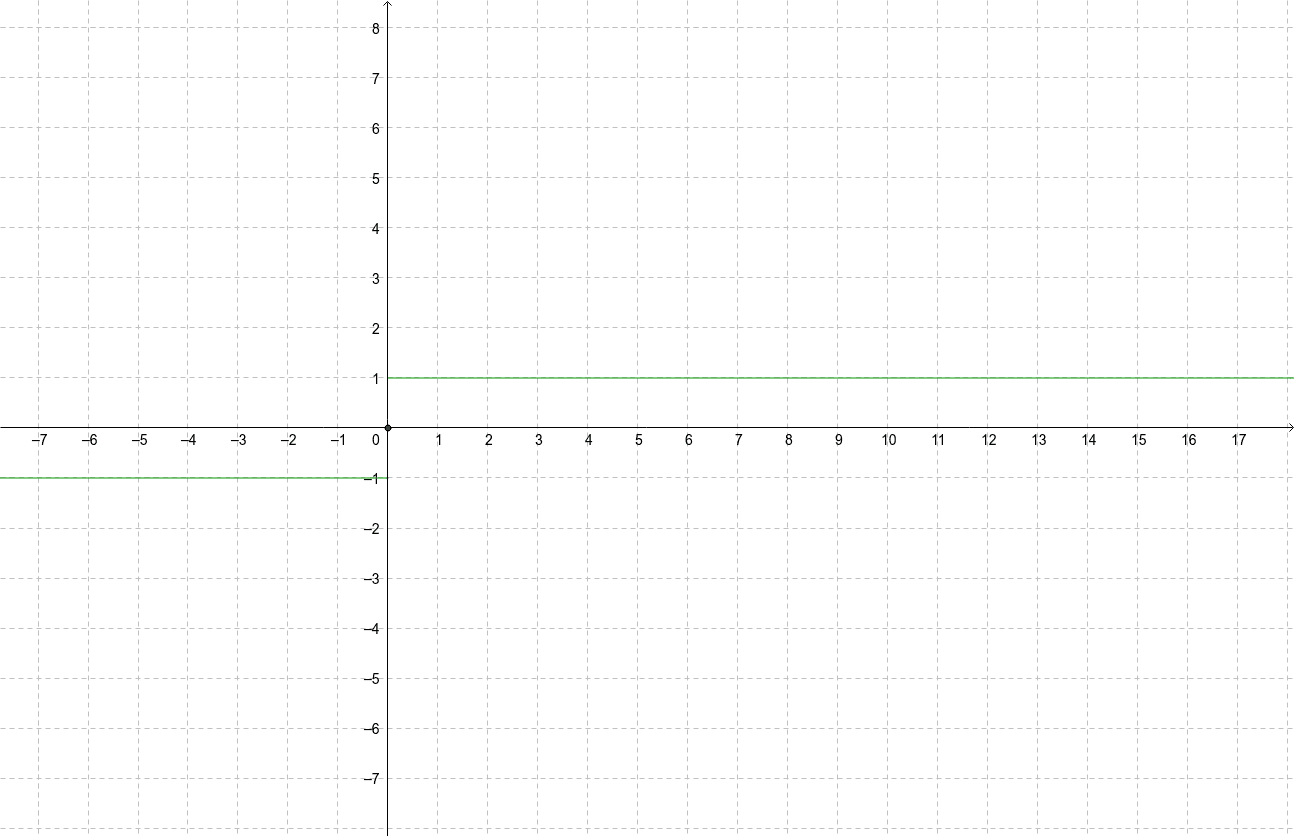
This example demonstrates how to plot the range of a discontinuous function using GeoGebra. Key mathematical concepts include continuity, function range, and limit ideas. Construction involves using the Function command to define functions f and g, and the object O for graphical setup. Suitable for high school students learning function properties or for mathematical modeling courses in function graph analysis.
GeoGebra Commands & Parameters
Function(-1, -1000, 0) → fFunction(1, 0, 1000) → g
AI Drawing Prompt Reference
Plot a graph of a discontinuous function, including two piecewise functions f and g. f is -1 when x is less than 0 and -1000 when x equals 0; g is 1 when x is greater than 0 and 0 when x equals 0.
The prompt above was compiled from the original drawing commands and is for reference only.