
Power Functions with Equilateral Triangles and Linear Equations
Loading the math board and drawing, please wait…
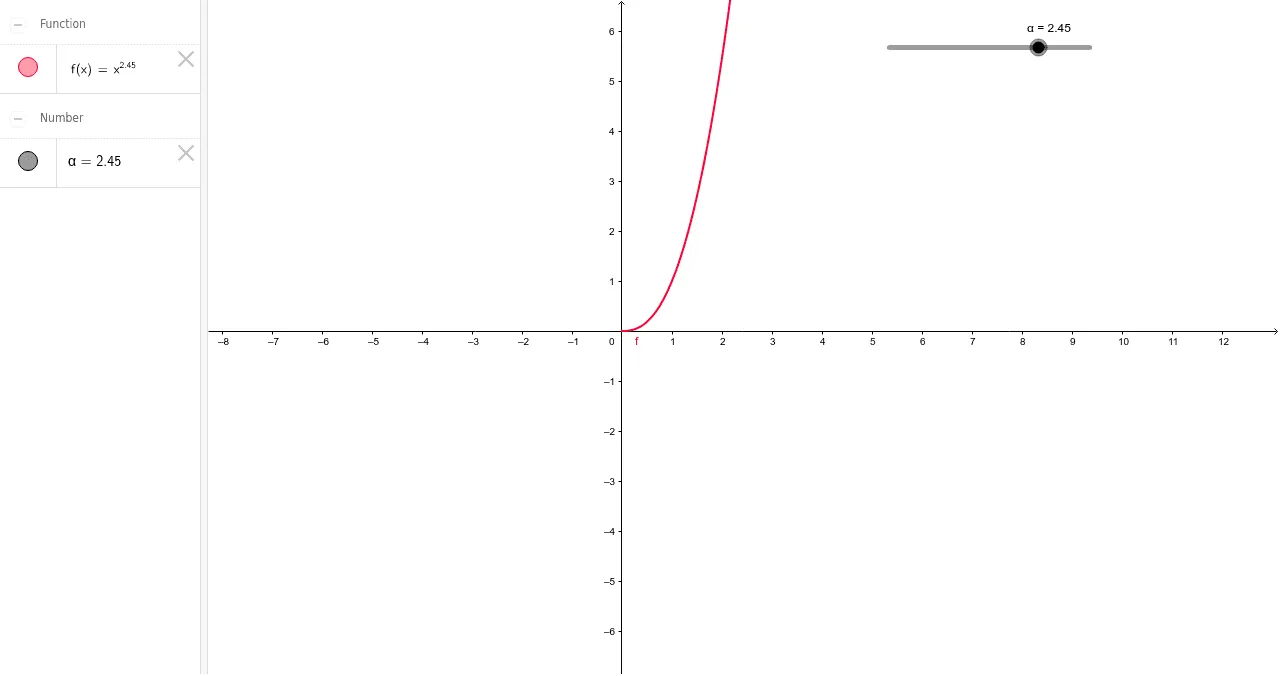
This GeoGebra example demonstrates power functions (y = x^α) and their graphical representation, intertwined with equilateral triangles, linear equations, and combinatorial concepts. The core mathematical concepts include the definition and graph characteristics of power functions, such as how the exponent α affects the curve's shape (parabolas, hyperbolas, cubic curves, etc.), geometric properties of equilateral triangles, linear functions and their equations, and basic combinatorial counting principles. Construction highlights: based on the summary, the example uses objects α and f, likely with a slider for α to dynamically change the exponent, and a function f to plot the power curve. It may also incorporate equilateral triangles and linear equations as additional visual elements, utilizing GeoGebra commands for function input, sliders, and geometric object creation. This resource is suitable for high school or early college students to explore how power function graphs vary with parameters, and to see interdisciplinary connections between algebra, geometry, and combinatorics. It can serve as a classroom demonstration or a self-guided exploration tool.
GeoGebra Commands & Parameters
Numeric α(2.45)f(x) = x^(α)
AI Drawing Prompt Reference
Create a dynamic graph showing power functions y = x^α, featuring a slider to adjust α and observe how the function's shape changes with different values of α, including parabolas, hyperbolas, and cubic curves. Also incorporate equilateral triangles and linear equations as visual aids to illustrate the connections between power functions, geometry, and algebra.
The prompt above was compiled from the original drawing commands and is for reference only.