
Uniform Continuity Exploration: Dynamic Visualization
Loading the math board and drawing, please wait…
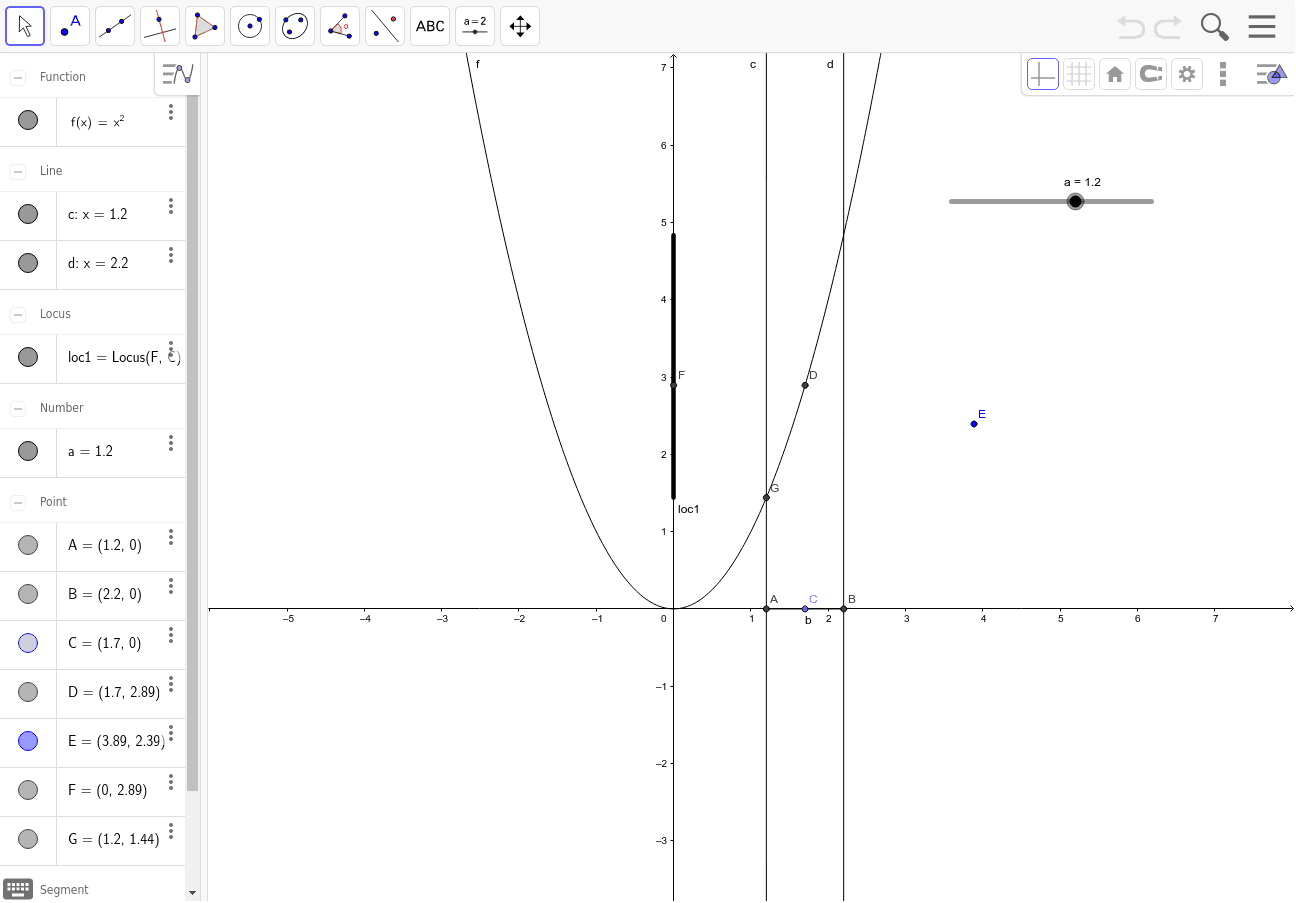
① This example dynamically demonstrates the concept of uniform continuity of a function, allowing users to adjust parameters and observe how the function behaves over an interval. ② Core mathematical concepts include uniform continuity, continuity, the epsilon-delta definition, function graphs, and loci. ③ Construction highlights: using GeoGebra commands such as Segment, Point, Locus, and Intersect, the example builds function f, moving points A/B, intersection points C/D/E/F, and locus loc1, with sliders a and b controlling the interval and parameters to visually compare uniform continuity with ordinary continuity. ④ Suitable for university-level mathematical analysis or advanced calculus courses, and also for high school students seeking a deeper understanding of continuity through interactive exploration.
GeoGebra Commands & Parameters
Segment(A, B) → bPoint(b) → CLocus(F, C) → loc1Intersect(f, c) → G
AI Drawing Prompt Reference
Draw the graph of function f and dynamically adjust parameters a and b within the interval [a, b]. Observe how the graph of function f changes. Create point C that moves along segment b, and let point F trace locus loc1 as C moves. Finally, find the intersection point G between function f and line c.
The prompt above was compiled from the original drawing commands and is for reference only.