
Second Translation Theorem
Loading the math board and drawing, please wait…
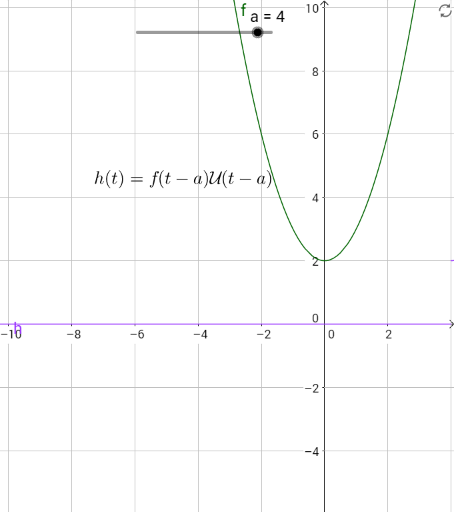
This example illustrates the second part of the translation theorem, which describes the transformation rules of function graphs when shifted along the x-axis or y-axis. Key mathematical concepts include function transformation and translation. By constructing the function f, the translated functions g and h, and adding the text1 annotation, the example visually demonstrates the properties of translation transformations. Suitable for high school mathematics education and learning, aiding students in understanding the translation of function graphs.
GeoGebra Commands & Parameters
Numeric a(4)f(x) = x^(2) + 2g(x) = f(x - a)h(x) = If[x ≤ a, 0, g]
AI Drawing Prompt Reference
Draw the graph of function f(x) = x^2 + 2, then shift it 4 units to the right to get g(x) = f(x - 4) and draw g(x)’s graph. Next, draw the graph of h(x) = If[x ≤ 4, 0, g(x)], indicating that h(x) is 0 when x is less than or equal to 4, and equals g(x) otherwise.
The prompt above was compiled from the original drawing commands and is for reference only.