
Two Variable Linear Inequalities
Loading the math board and drawing, please wait…
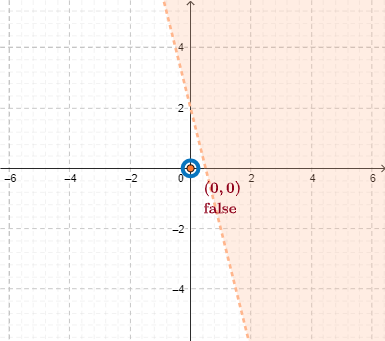
This example demonstrates the graphical representation of two-variable linear inequalities. Key mathematical concepts include linear inequalities, coordinate systems, and the solution set of inequalities. Using GeoGebra commands such as Shuffle, Element, and Textfield, the solution region of the inequalities can be dynamically displayed. Suitable for students at the junior high school level and above to learn the geometric meaning of linear inequalities.
GeoGebra Commands & Parameters
Shuffle({-5, -4, -3, -2, -1, 1, 2, 3, 4, 5}) → l1, {-4, 4, -1, 2, -2, 1, 3, -5, -3, 5}Shuffle({-5, -4, -3, -2, -1, 1, 2, 3, 4, 5}) → l2, {-2, -1, 1, 4, -3, -4, -5, 2, 5, 3}Element(l1, 1) → a1Element(l2, 1) → b1Textfield(a) → inputBox1
AI Drawing Prompt Reference
Draw the solution sets of two linear inequalities on a coordinate system by first generating two random sequences of positive and negative integers, selecting two numbers from each sequence as the intercepts of lines, then plotting these lines on the coordinate plane, shading the regions that satisfy the inequalities, and finally adding a text box next to the graph for inputting parameters.
The prompt above was compiled from the original drawing commands and is for reference only.