
Two-Set Venn Diagram Logic with Circles
Loading the math board and drawing, please wait…
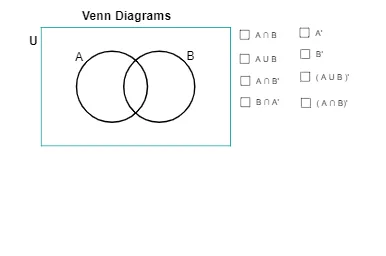
This example demonstrates Venn diagram logic for two sets, visually connecting set operations (intersection, union, and set differences) with geometric overlap regions. The key mathematical ideas are set theory (the meaning of elements belonging to both sets or only one set) and the geometric interpretation of sets using circles as boundaries. The construction uses GeoGebra commands to build the diagram: Point to create key points (such as intersection and label locations), Circle to draw two circles representing the sets, Intersect to compute their intersection points, and CircleArc/CircumcircleArc to trace circular arc boundaries of the regions. Polygon is then used to form region outlines for highlighting/filling, while text1/text2 provide clear labels. Suitable for middle school to early university settings, especially when teaching basic set operations, logical reasoning, and geometric visualization.
GeoGebra Commands & Parameters
Point(xAxis) → ECircle(E, 3) → ePoint(xAxis) → FCircle(F, 3) → fIntersect(e, f) → G, H, ,CircleArc(F, G, H) → gCircleArc(E, H, G) → hCircle(F, 3) → kCircle(E, 3) → pPoint(e) → APoint(f) → RCircumcircleArc(G, A, H) → sCircleArc(F, G, H) → tCircumcircleArc(G, R, H) → e_1CircleArc(E, H, G) → f_1Polygon(I, L, K, J) → poly4, i_1, l_1, k_1, j_1Circle(F, 2.95) → g_1Circle(E, 2.95) → h_1CircleArc(F, G, H) → q_1CircleArc(E, H, G) → r_1
AI Drawing Prompt Reference
Draw a Venn diagram with two circles to represent the intersection, union, and set differences of two sets. Start by creating two points E and F on the x-axis and drawing two circles e and f with radius 3 centered at E and F, respectively. Find the intersection points G and H of the two circles and draw arcs g and h from G to H to represent the intersection. Then draw circles k and p with F and E as centers and arcs s and t from G to H to represent the set differences. Finally, use the arcs to outline four regions and label the sets.
The prompt above was compiled from the original drawing commands and is for reference only.