
Two Linear Distributions
Loading the math board and drawing, please wait…
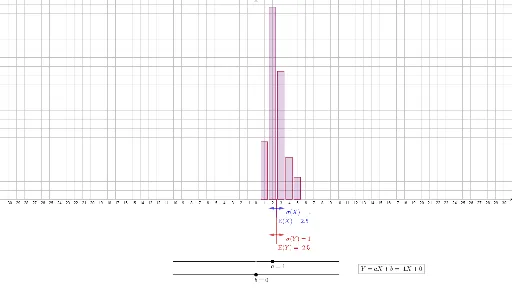
This example demonstrates the graphical and statistical properties of two linear distributions. It involves concepts of mean and standard deviation in probability and statistics. Using GeoGebra commands such as Segment, Point, Sequence, etc., two linear distributions can be constructed. Suitable for high school math education and learning.
GeoGebra Commands & Parameters
Segment((-10, (bdepth * ymin)), (10, (bdepth * ymin))) → bregionPoint(bregion) → thebSequence(5) → barloc1Point(aregion) → theaIf(a < 0, Reverse[freq1], freq1) → freq2Sort((barloc1 * a) + b) → barloc2BarChart(barloc1, freq1, 0.8) → dist1BarChart(barloc2, freq2, barwidth) → dist2mean(barloc1, freq1) → mean1stdevp(barloc1, freq1) → sd1Segment(Meanpos1, (mean1, 0)) → meanline1Segment(Meanpos2, (mean2, 0)) → meanline2Vector((mean1, (sddepth1 * ymin)), (mean1 - sd1, (sddepth1 * ymin))) → sdleft1Vector((mean2, (sddepth2 * ymin)), (mean2 - sd2, (sddepth2 * ymin))) → sdleft2Vector((mean1, (sddepth1 * ymin)), (mean1 + sd1, (sddepth1 * ymin))) → sdright1Vector((mean2, (sddepth2 * ymin)), (mean2 + sd2, (sddepth2 * ymin))) → sdright2Sum(freq1) → probsum
AI Drawing Prompt Reference
Create a statistical chart showing two linear distributions. Draw a horizontal baseline at the bottom. Above it, place two sets of vertical bars of equal width, with heights representing frequencies. The two bar sets are positioned separately, one shifted and sorted. For each set, compute the mean and draw a vertical line from the mean position down to the baseline. Below the baseline, use horizontal arrow vectors to indicate standard deviation ranges, extending left and right from each mean by one standard deviation. The chart visually compares the two distributions, highlighting their means and standard deviations.
The prompt above was compiled from the original drawing commands and is for reference only.