
Trigonometric & Vector Sequence GeoGebra Demo
Loading the math board and drawing, please wait…
In collections
Mapping Diagrams: From AB to C&DE, Resource
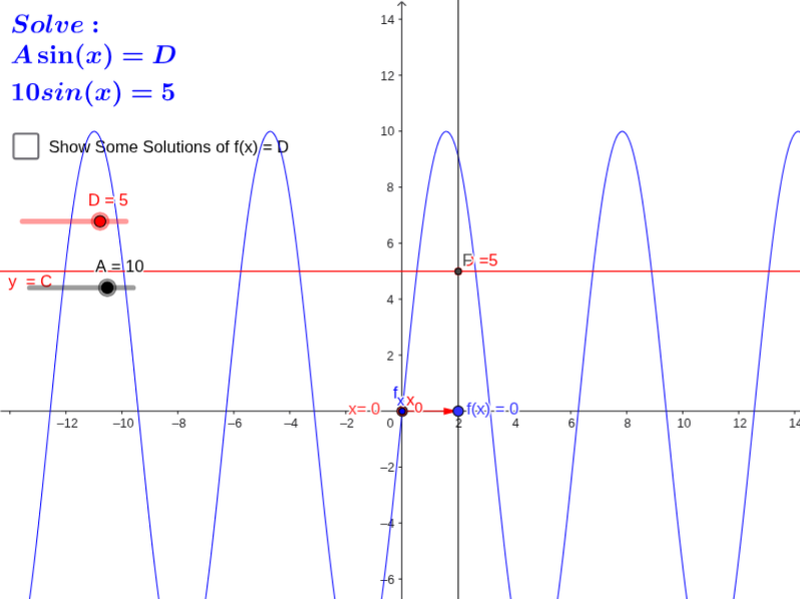
This example dynamically demonstrates the relationship between trigonometric functions and 2D vectors using GeoGebra, integrating sequence construction and pie charts. Key math concepts include trigonometric functions, vector operations, sequences, and coordinate geometry. It utilizes commands like Point, Vector, Textfield, Segment, Sequence, Zip to construct points, vectors, segments, and dynamic sequences. Suitable for high school mathematics teaching to understand function graphs, vector properties, and sequence applications.
GeoGebra Commands & Parameters
Point(yAxis) → A_1Vector(A_1, B_1) → uTextfield(f) → inputBox1Vector(A_1, B_2) → vVector(B_2, A_2) → wVector(x_*, C_1) → zSegment(D_1, X) → jSequence(t, t, (-6 * π / B), (5 * π / B), (2 * π / B)) → numsZip((0, sol1 + k), k, nums) → SourcePtsMDZip((0, sol2 + k), k, nums) → SourcePtsSupMDZip((sol1 + k, f(sol1 + k)), k, nums) → TrigGraphptsZip((sol2 + k, f(sol2 + k)), k, nums) → TrigGraphPtsSupZip(Vector[(0, sol1 + k), (2, f(sol1 + k))], k, nums) → TrigMDZip(Vector[(0, sol2 + k), (2, f(sol2 + k))], k, nums) → TrigMDSup
AI Drawing Prompt Reference
Create a dynamic illustration showing the relationship between trigonometric functions and 2D vectors, including points and vectors on coordinate axes, a text box for defining trigonometric functions, vectors representing dynamic sequences, line segments, and pie charts to display function graphs, vector properties, and sequence applications.
The prompt above was compiled from the original drawing commands and is for reference only.