
Trigonometric Symmetry Example
Loading the math board and drawing, please wait…
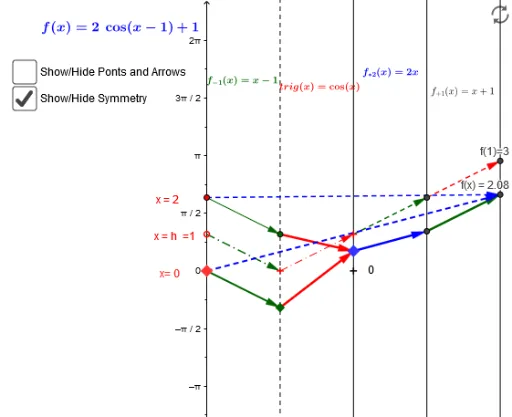
This example demonstrates the symmetry of trigonometric functions, focusing on the periodicity and symmetry of sine and cosine functions. Using GeoGebra commands such as Point, Segment, Vector, Sequence, etc., it allows dynamic observation of changes in the trigonometric function graphs. Suitable for high school mathematics education and learning, particularly for topics related to trigonometric functions and function graphs.
GeoGebra Commands & Parameters
Point(yAxis) → aSegment(C, D) → eVector(G, H) → wSegment(f_x, J) → jSequence(h - π, h + π, π / 6) → x_*Zip((k, f(k)), k, x_*) → list1Zip(Segment[(i, f(i)), ((2 * h) - i, f((2 * h) - i))], i, x_*) → list3Zip(Segment[(i, f(i)), (π - i, f(π - i))], i, x_*) → suplZip(Vector[(0, t), (1, s(t))], t, x_*) → l1Vector(a, L) → mVector(L, B) → nVector(E, M) → qVector(M, B) → rVector(C, N) → tVector(N, O) → u_1Vector(O, P) → v_1Vector(P, Q) → w_1Vector(B, R) → b_1Vector(R, S) → c_1Vector(a, S) → uVector(E, S) → vZip(Vector[(0, k), (4, f(k))], k, x_*) → list2Zip(Vector[(1, s(t)), (2, p(s(t)))], t, x_*) → l2Zip(Vector[(2, p(s(t))), (3, A1(p(s(t))))], t, x_*) → l3Zip(Vector[(3, A1(p(s(t)))), (4, D1(A1(p(s(t)))))], t, x_*) → l4
AI Drawing Prompt Reference
Draw the graph of the sine function to demonstrate its periodicity and symmetry. Start by creating a point a on the y-axis, then draw a line segment e between points C and D, and finally draw vector w. Use the sequence command to generate a series of points and plot their graphs to show their symmetry. Lastly, draw a series of vectors to help observe the periodicity and symmetry of the sine function.
The prompt above was compiled from the original drawing commands and is for reference only.