
Trigonometric Sequence and 3D Shape Demonstration
Loading the math board and drawing, please wait…
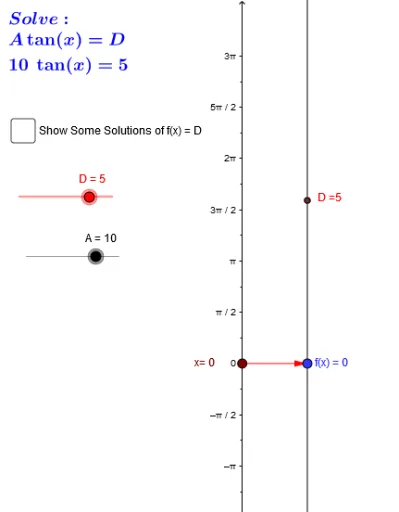
This example demonstrates the dynamic changes and graphical construction of trigonometric sequences in 3D space; involves core math concepts like trigonometric functions, sequences, 3D geometry, and vector operations; construction highlights: using commands like Point, Vector, Sequence, Zip to create points, vectors, and sequences, combined with Segment, Textfield for graphical interface; suitable for high school and above mathematics teaching, for understanding the integration of functions, sequences, and spatial geometry.
GeoGebra Commands & Parameters
Point(yAxis) → A_1Vector(A_1, B_1) → uTextfield(f) → inputBox1Vector(A_1, B_2) → vVector(B_2, A_2) → wVector(x_*, C_1) → zSegment(D_1, X) → jSequence(t, t, (-6 * π / B), (6 * π / B), (2 * π / B)) → numsZip((0, sol1 + k), k, nums) → SourcePtsMDZip((0, sol2 + k), k, nums) → SourcePts2MDZip((sol1 + k, f(sol1 + k)), k, nums) → TrigGraphptsZip((sol2 + k, f(sol2 + k)), k, nums) → TrigGraphPts2Zip(Vector[(0, sol1 + k), (2, f(sol1 + k))], k, nums) → TrigMDZip(Vector[(0, sol2 + k), (2, f(sol2 + k))], k, nums) → TrigMDSup
AI Drawing Prompt Reference
Create a 3D space demonstration of a trigonometric sequence, including a point A on the x-axis, vector u from A to B1, vector v from A to B2, vector w from B2 to A2, and vector z from x-axis point x_* to C1. Use these vectors and points to construct a series of points forming the trigonometric graph. Dynamically adjust parameters to show the changes in the trigonometric sequence.
The prompt above was compiled from the original drawing commands and is for reference only.