
Transformations of Sine Graphs
Loading the math board and drawing, please wait…
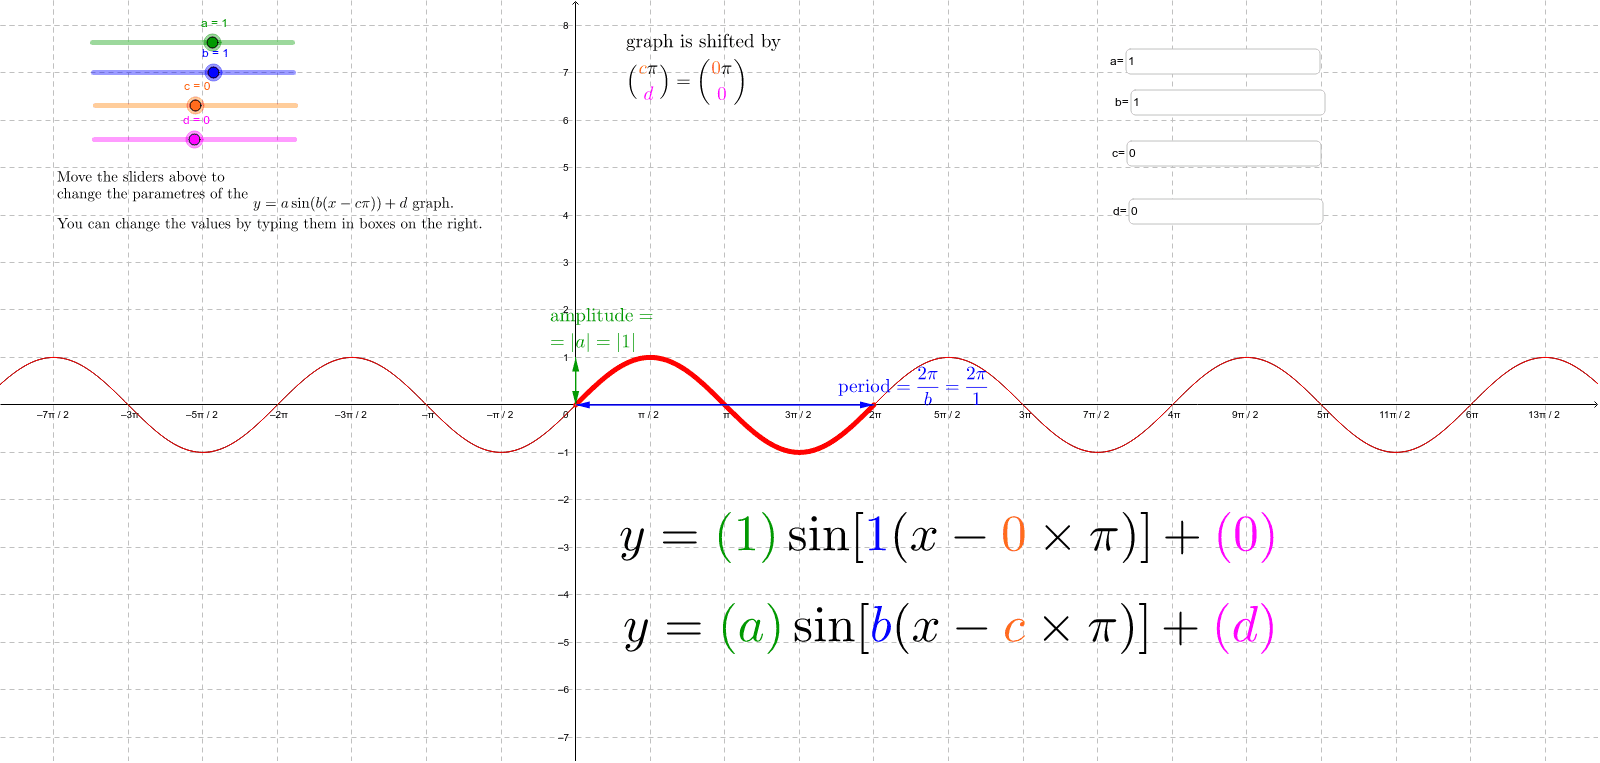
This example demonstrates the geometric transformations of sine function graphs. It involves core math concepts like function graph transformations, trigonometric properties, and vector operations. Constructed using GeoGebra commands such as Textfield, Function, Vector, and objects like O, d, c, A, D, f, a, inputBox1, b, inputBox2, inputBox3, inputBox4, g, h, text1, text2, B, u, v, text3, C, w, e, i, text4, j, text5, text6. Suitable for high school mathematics teaching to understand translation, scaling, and other transformation rules of function graphs.
GeoGebra Commands & Parameters
Textfield(a) → inputBox1Textfield(b) → inputBox2Textfield(c) → inputBox3Textfield(d) → inputBox4Function((a * sin((b * (x - (π * c))))) + d, (π * c), (π * c) + (2 * π / b)) → hVector(A, B) → uVector(B, A) → vVector(A, C) → wVector(C, A) → eVector(O, D) → iVector(D, A) → j
AI Drawing Prompt Reference
Create four adjustable input fields for parameters a, b, c, and d that control the amplitude, angular frequency, horizontal phase shift, and vertical translation of a sine wave. Plot the function y = a·sin(b·(x−πc)) + d over one period, starting at x = πc and ending at x = πc + 2π/b. Then mark key points on the curve and draw vectors between them: from the origin to a reference point, reciprocal vectors between two points, and vectors representing the horizontal and vertical shifts, illustrating the scaling and translation transformations of the sine graph.
The prompt above was compiled from the original drawing commands and is for reference only.