
Transformations of Exponential Functions
Loading the math board and drawing, please wait…
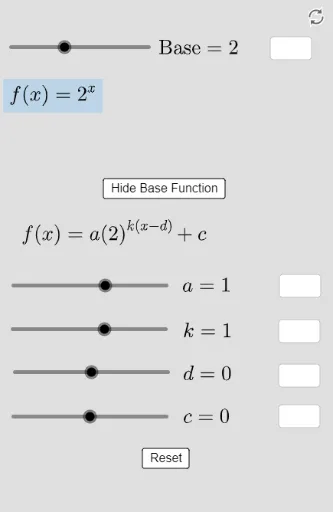
This activity explores the transformations of exponential functions. By adjusting parameters, you can observe the changes in the graph of the exponential function. Key mathematical concepts include the properties and transformations of exponential functions. GeoGebra commands used include If, Text, Textfield, and function objects. Suitable for high school mathematics education and learning.
GeoGebra Commands & Parameters
If(d ≟ 0, "", If[d > 0, "-", "+"]) → signdText(If[d ≠ 0, abs(d), ""]) → vdText(If[c ≠ 0, abs(c), ""]) → vcIf(c ≟ 0, "", If[c > 0, "+", "-"]) → signcText(If[a ≠ 1 ∧ a ≠ -1, abs(a), ""]) → vaText(If[k ≠ 1 ∧ k ≠ -1, abs(k), ""]) → vkIf(k ≠ 1 ∧ d ≠ 0, "(", "") → squareLIf(k ≠ 1 ∧ d ≠ 0, ")", "") → squareRIf(a ≟ 1, "", "(") → roundLIf(a ≟ 1, "", ")") → roundRText(If[a < 0, "-", ""]) → signaText(If[k < 0, "-", ""]) → signkTextfield(empty) → InputBox2Textfield(empty2) → InputBox3Textfield(empty3) → InputBox4Textfield(empty4) → InputBox5Textfield(empty5) → InputBox1
AI Drawing Prompt Reference
Draw the graph of an exponential function to show how changes in parameters affect its shape. Adjust parameters to observe vertical and horizontal shifts, as well as stretches and compressions. Include symbols indicating the direction of transformations and input boxes for interactive exploration. Start with the base function, then add transformation indicators, and finally incorporate parameter input fields for dynamic visualization.
The prompt above was compiled from the original drawing commands and is for reference only.