
Transformation of Sine and Cosine Graphs by Mathguru
Loading the math board and drawing, please wait…
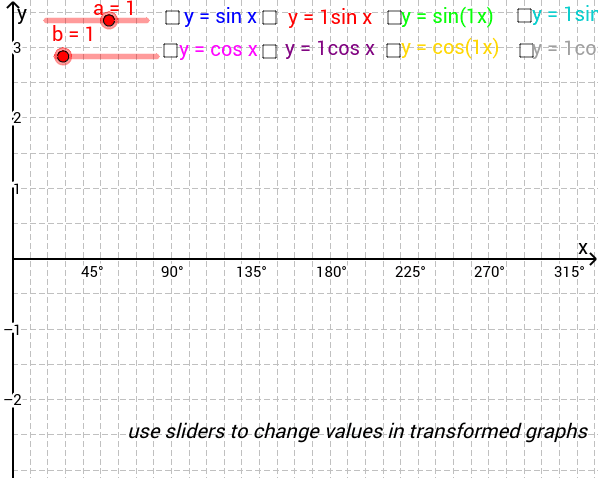
This example demonstrates the transformation of sine and cosine graphs including translations and scalings. Key math concepts involved are trigonometric functions, function transformations (translations, scalings), amplitude, and period. It is constructed using GeoGebra commands like Function, Segment, and Slider to dynamically adjust parameters a and b, showing the effects of transformations. Suitable for high school mathematics teaching to understand the rules of function graph transformations.
GeoGebra Commands & Parameters
Function(sin(x°), 0, 360) → sinx_1Function(a * sin(x°), 0, 360) → asinx_1Function(cos(x°), 0, 360) → cosx_1Function(sin((b * x)°), 0, 360) → sinbx_1Function(a * cos(x°), 0, 360) → acosx_1Function(cos((b * x)°), 0, 360) → cosbx_1Function(a * cos((b * x)°), 0, 360) → acosbx_1Function(a * sin((b * x)°), 0, 360) → asinbx_1Segment(C, D) → a_1Segment(E, F) → b_1
AI Drawing Prompt Reference
Draw sine and cosine functions with their translations and scalings. First, draw the standard sine and cosine curves. Then, adjust parameters a and b to change the amplitude and period of the sine and cosine curves. Finally, show the translation and scaling effects of the sine and cosine curves.
The prompt above was compiled from the original drawing commands and is for reference only.