
Traditional Demonstration of Variance and Continuity via Parabola Translation
Loading the math board and drawing, please wait…
In collections
geometriadinamica.es
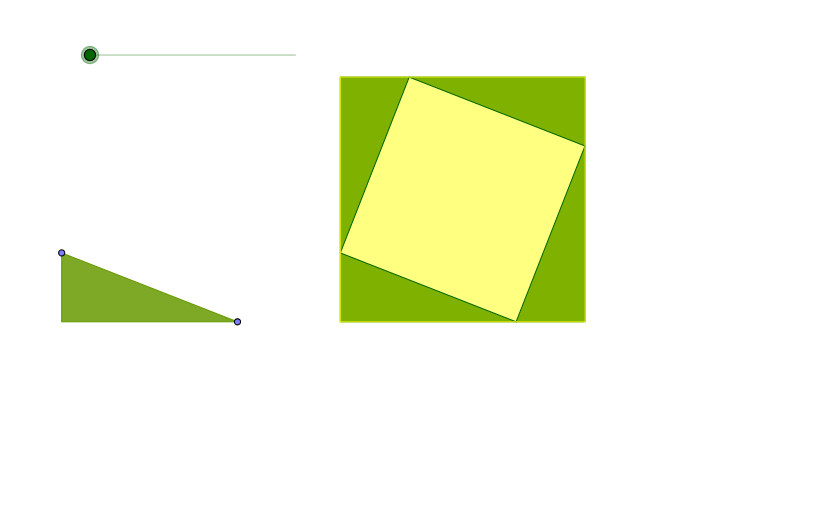
This GeoGebra example presents a traditional geometric demonstration linking variance, continuity, and correlation through a parabola. It visually shows how data points (or function values) are distributed around a curve, using translations and vectors to illustrate the concept of dispersion and its connection to function behavior. The construction employs commands such as Segment, Point, Polygon, Vector, and Translate, generating numerous objects (a, g, f, d2, d1, d3, etc.) and translated copies (A', D', E', P', etc.) to build a comprehensive visual proof. This is suitable for high school or early college students learning statistics and functions, and serves as an effective classroom demonstration for teachers explaining variance in a geometric context.
GeoGebra Commands & Parameters
Segment(A, C) → eSegment(A, B) → hPoint(h) → DPoint(e) → EPolygon(A, D, E) → P, e_1, a_1, d_1Vector(A, F) → uTranslate(A, u) → A'Translate(D, u) → D'Translate(E, u) → E'Polygon(A', D', E') → P', e', a', d'Polygon(K, J, D') → Q, d'_1, k, jPolygon(K, H, I) → R, i, k_1, h_1Polygon(G, H, E') → S, e'_1, g_1, h_2Translate(K, v) → K'Translate(H, v) → H'Translate(I, v) → I'Polygon(K', H', I') → R', i', k', h'Translate(G, w) → G'Translate(H, w) → H'_1Translate(E', w) → E''Polygon(G', H'_1, E'') → S', e'', g', h'_1Translate(K, z) → K'_1Translate(J, z) → J'Translate(D', z) → D''Polygon(K'_1, J', D'') → Q', d'', k'_1, j'Polygon(J, I, G, A') → T, j_1, i_1, g_2, a'_1
AI Drawing Prompt Reference
Draw a geometric figure demonstrating variance and continuity via parabola translation. The figure should include a parabola as the base curve, and data points or function values distributed around it. Key objects include translated parabola copies, points, vectors, and multiple polygons, which are interconnected through translation and vector transformations. The construction order should start by drawing basic segments and points, constructing vectors, then translating points to generate copies, and finally connecting these objects through polygon construction to form a complete visual proof.
The prompt above was compiled from the original drawing commands and is for reference only.