
Thermometer - Positive and Negative Numbers
Loading the math board and drawing, please wait…
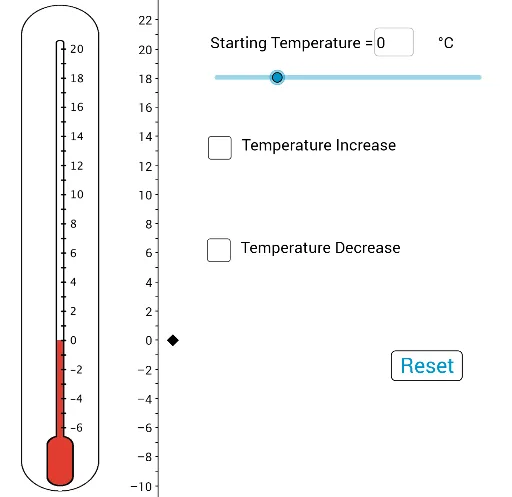
This example demonstrates positive and negative numbers using a thermometer visualization. It involves core math concepts like number line representation, temperature changes, and their practical applications. Constructed with GeoGebra commands like Midpoint, Polygon, Textfield, and Vector, it is suitable for middle school mathematics education to help students grasp the concept of positive and negative numbers on a number line and real-world scenarios.
GeoGebra Commands & Parameters
Midpoint(A, B) → GPolygon(C, D, F, E) → poly1, h, d, f, eTextfield(a) → InputBox1Textfield(b) → InputBox2Vector(H, I) → uTextfield(c) → InputBox3
AI Drawing Prompt Reference
Draw a thermometer to demonstrate positive and negative numbers, including a number line for temperature changes, polygons for the thermometer's scales, text boxes for inputting temperature values, and a vector indicating the direction of temperature change, suitable for middle school students to understand the representation and real-world application of positive and negative numbers on a number line.
The prompt above was compiled from the original drawing commands and is for reference only.