
The Squeeze Theorem (I): Visualizing Limits
Loading the math board and drawing, please wait…
In collections
Calculus: Limits & Continuity
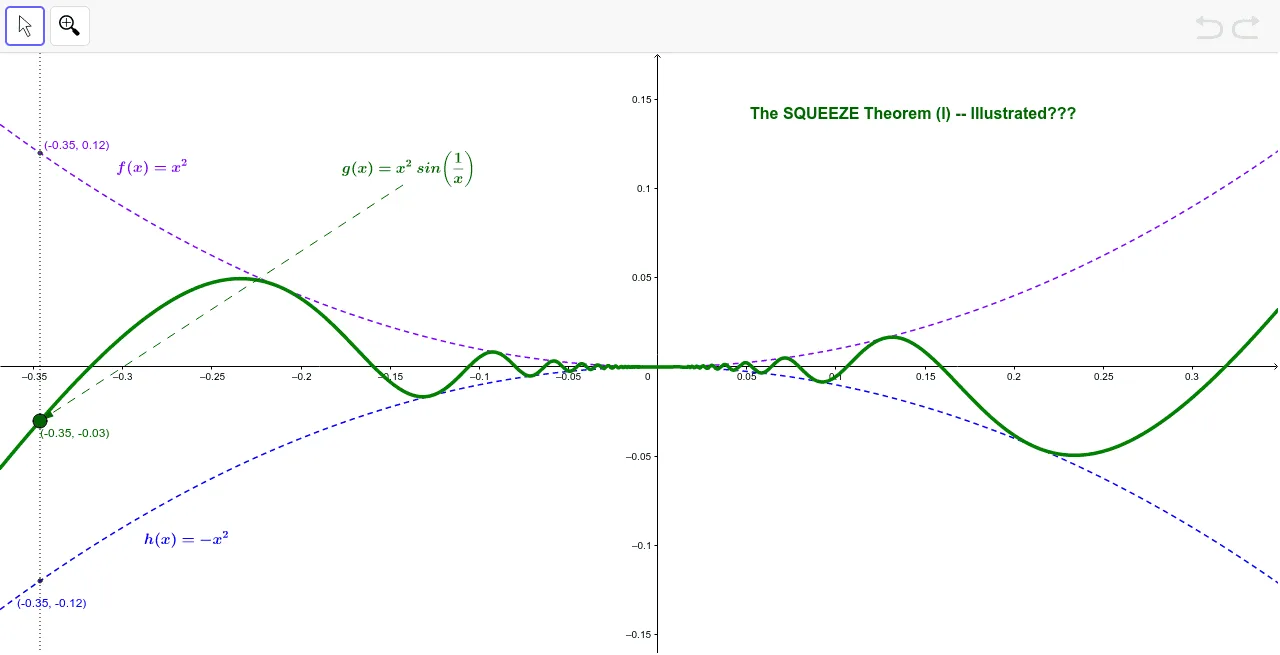
This applet demonstrates the Squeeze Theorem using the function g(x) = x^2 * sin(1/x). Students can explore the limit of g(x) as x approaches 0. Commands used include Point, Vector, and Intersect. Suitable for high school mathematics education.
GeoGebra Commands & Parameters
Point(f) → AVector(B, A) → uIntersect(c, a) → C,Intersect(d, a) → D,
AI Drawing Prompt Reference
Draw a graph illustrating the Squeeze Theorem. The graph should include a function curve generated from points, with vectors indicating direction. The curve should intersect a horizontal line at two points. These intersection points help illustrate the limit process. The construction order is to draw points first, then vectors, then find intersections. The graph should clearly show the behavior of the curve as x approaches 0, and how the intersection points help understand the limit.
The prompt above was compiled from the original drawing commands and is for reference only.