
The Daisy: A Flower for Fractions
Loading the math board and drawing, please wait…
In collections
The Fractions book
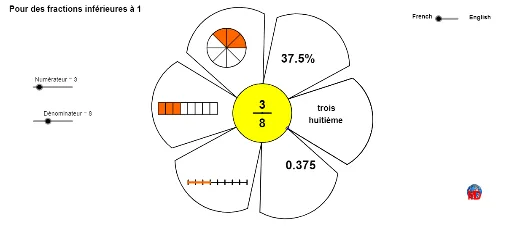
This example dynamically demonstrates the construction of a daisy flower, visually illustrating the relationship between fractions (numerator and denominator) and polygons. Core mathematical concepts include fractions, polygon construction, logarithmic functions, continuity, and distributions. GeoGebra commands and objects used in the construction are Circle, Point, Rotate, Midpoint, CircumcircleArc, Segment, Sequence, Text, Polygon, and CircleSector. Suitable for high school mathematics education, aiding in understanding the geometric applications of fractions, polygons, and logarithmic functions.
GeoGebra Commands & Parameters
Circle(A, R) → cPoint(c) → BRotate(B, 1.0471975511965976, A) → HRotate(B, 0.5236, A) → GMidpoint(G, H) → CMidpoint(C, H) → ICircumcircleArc(D, E, F) → d_1CircumcircleArc(B, G, H) → eSegment(B, D) → aSegment(H, F) → bSequence(Rotate[liste1, ((i * 2) * π / 6), A], i, 0, 6) → liste2Midpoint(E, G) → JMidpoint(J, G) → KText(Element[listnum, Numérateur]) → texte1Text(Element[listden, Dénominateur]) → texte2Rotate(K, -1.0471975511965976, A) → K'Rotate(K, 1.0471975511965976, A) → K'_1Rotate(K, 2.0943951023931953, A) → MCircle(L, R / 1.5) → fSequence(Rotate[N, ((i * 2) * π / Dénominateur), L], i, 0, Dénominateur) → liste3Sequence(Segment[L, Element[liste3, i]], i, 1, Length[liste3]) → liste4Rotate(L, 1.0471975511965976, A) → PSequence(Q + (0, 1) + (i * Vector[Q, O] / Dénominateur), i, 0, Dénominateur) → liste6Polygon(S, T, O, Q) → poly1, s, t, o, qSequence(Q + (i * Vector[Q, O] / Dénominateur), i, 0, Dénominateur) → liste5Sequence(Segment[Element[liste5, i], Element[liste6, i]], i, 1, Length[liste6]) → liste7Polygon(Q, Element[liste5, Numérateur + 1], Element[liste6, Numérateur + 1], S) → poly2, h, i, l, mRotate(P, 1.0471975511965976, A) → P'Sequence(Z + (0, 0.2) + (i * Vector[Z, W] / Dénominateur), i, 0, Dénominateur) → liste8Sequence(Z - (0, 0.2) + (i * Vector[Z, W] / Dénominateur), i, 0, Dénominateur) → liste9Segment(Z, W) → jSequence(Segment[Element[liste8, i], Element[liste9, i]], i, 1, Length[liste8]) → liste10Segment(Z, Z + (Numérateur * Vector[Z, W] / Dénominateur)) → kCircleSector(L, N, Element[liste3, Numérateur + 1]) → gSegment(A - (0.75, 0), A + (0.75, 0)) → pCircle(A, R) → rText(Element[listnumang, Numérateur]) → texte9Text(Element[lisdenang, Dénominateur]) → texte10
AI Drawing Prompt Reference
Draw a daisy flower composed of multiple circles and sectors, with the number of petals controlled by a slider to visually demonstrate the relationship between fractions (numerator and denominator) and polygons. Start with a central circle, then rotate it to generate multiple sectors as petals. The number of petals is controlled by a slider, and each petal's size and position relates to the fraction. Use rotations and line segments to form the petal shapes. Add text labels around the diagram to display the numerator and denominator values, illustrating the geometric application of fractions.
The prompt above was compiled from the original drawing commands and is for reference only.