
Tests for Significant Correlation: Writing Conclusions
Loading the math board and drawing, please wait…
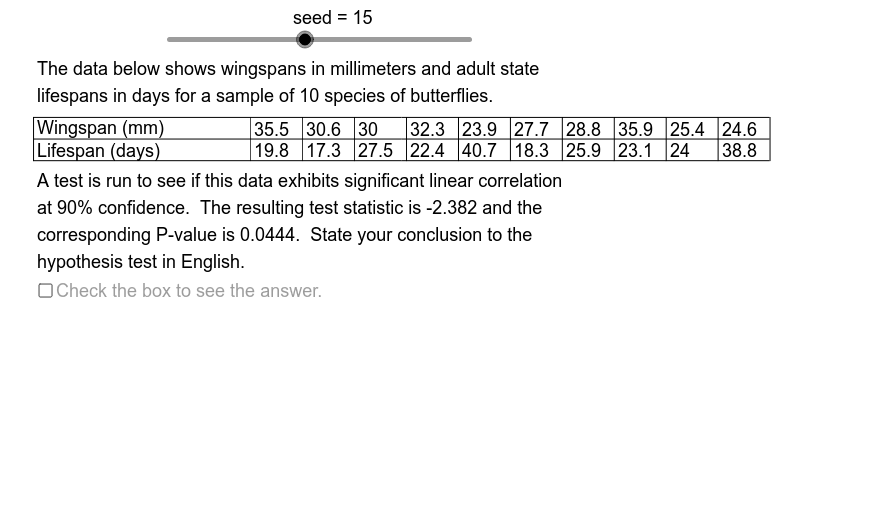
This example demonstrates how to use significance tests to determine the correlation between two variables and write conclusions. Key mathematical concepts include correlation testing and hypothesis testing. GeoGebra commands used include Sequence, Element, Length, Min, Max, If, Segment, PMCC, and Text. Suitable for high school and above students or teachers.
GeoGebra Commands & Parameters
Sequence(Mod[3 + (17 * k), 37] + 30, k, 1, 32) → OpSqElement(OpSq, seed) → Nmb1Element(DtXSq, Chc1) → DtX0Length(DtX0) → SizeElement(DtPlSq, Chc1) → DtPlElement(DtYSq, Chc1) → DtY0Min(DtY0) → YMinMax(DtY0) → YMaxMin(DtX0) → XMnMax(DtX0) → XMxIf((5 * XScLB) ≤ XScUB, (5 * XScLB), If[(2 * XScLB) ≤ XScUB, (2 * XScLB), XScLB]) → XAxScIf((5 * YScLB) ≤ YScUB, (5 * YScLB), If[(2 * YScLB) ≤ YScUB, (2 * YScLB), YScLB]) → YAxScSegment(DtUL, DtUR) → dttpSegment(DtML, DtMR) → dtmdSegment(DtLL, DtLR) → dtbtSegment(DtLL, DtUL) → dtlfPMCC(DtX0, DtY0) → RIf(RgLnSlp < 0, " - ", " + ") → SgnElement(CnfSq, Chc2) → ConfIf(PVl < 1.0E-4, "< 0.0001", ("= " * PVl)) → PVlTxSequence(AdpX(Element[DtX0, k]), k, 1, Size) → PltXSequence(AdpY(Element[DtY0, k]), k, 1, Size) → PltYSequence(Segment[(DtStr + 1.1 + (k * DtCW), DtLv), (DtStr + 1.1 + (k * DtCW), DtLv - (2 * DtCH))], k, 0, Size) → DtDvLnSequence(Text[Element[DtX0, k], (DtStr - 4.5 + (DtCW * k), DtLv - DtCH + 0.4)], k, 1, Size) → XDtVlsSequence(Text[Element[DtY0, k], (DtStr - 4.5 + (DtCW * k), DtLv - (2 * DtCH) + 0.4)], k, 1, Size) → YDtVlsText(Element[XAxTtlSq, Chc1], (DtStr - 23.65, DtLv - 1.9)) → XValsText(Element[YAxTtlSq, Chc1], (DtStr - 23.65, DtLv - 4.6)) → YValsIf(PVl < α, "reject", "keep") → KoRIf(PVl < α, "is", "is not") → IoNIf(PVl < α, "less than", "not less than") → LoN