
Temperature Graph with Thermometer Display
Loading the math board and drawing, please wait…
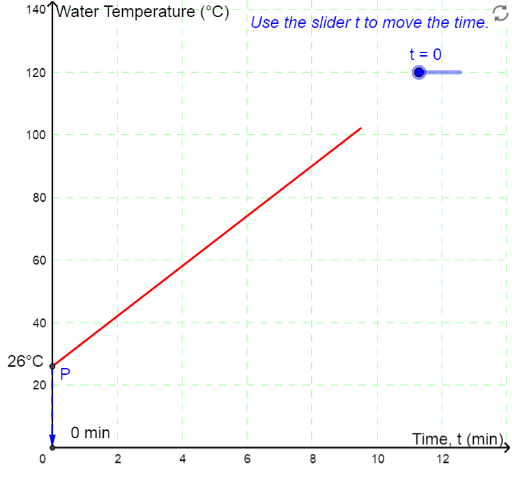
This applet demonstrates the temperature increase of water under constant heating. The core mathematical concept is functions. By constructing objects such as circles, vectors, and points, the linear growth of temperature over time is illustrated. Suitable for teaching function concepts.
GeoGebra Commands & Parameters
Circle((0, -8), 14) → cIntersect(c, xAxis) → A, BVector(P, P_{xaxis}) → uVector(P, P_{yaxis}) → vPoint(c) → CCircumcircleArc(A, C, B) → dSegment(A, A_t) → aSegment(B, B_t) → bPoint(yAxis) → DCircle(D, B_t) → eIntersect(e, yAxis, 2) → EPolygon(A_{tb}, B_{tb}, B_{tt}, A_{tt}) → poly1, i, j, k, lCircumcircleArc(A_t, E, B_t) → gCircle((0, -8), 8) → hSegment((0, 0), P_{therm}) → themometerline