
Taylor and Maclaurin Series Demonstration
Loading the math board and drawing, please wait…
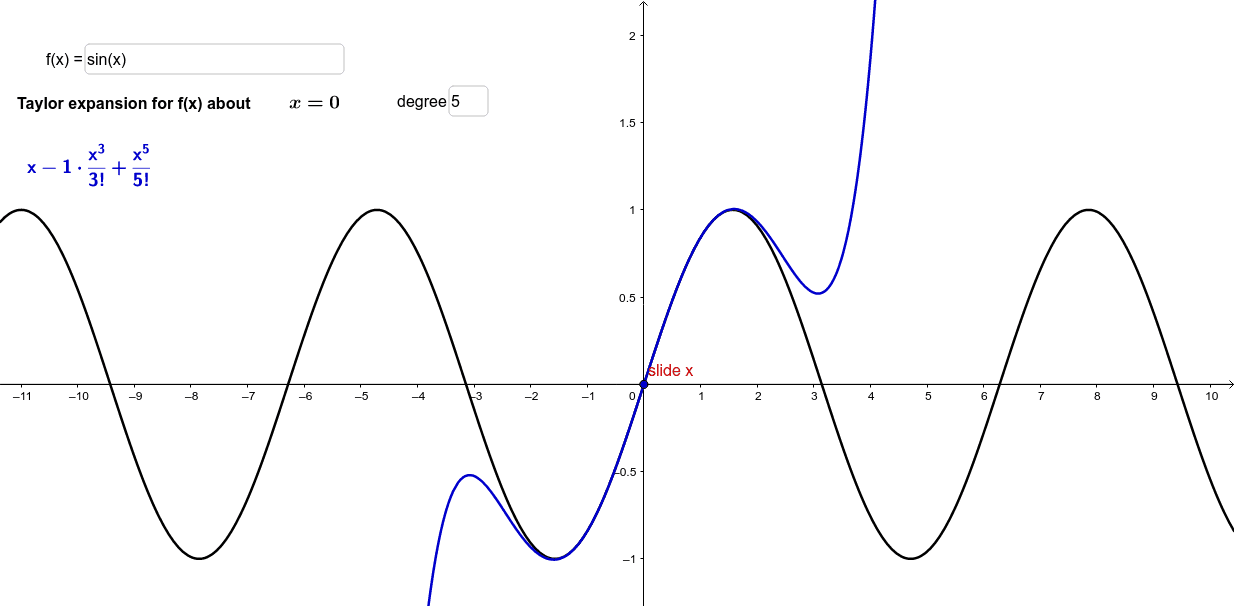
This example illustrates how to approximate a function using a Taylor series. It involves core mathematical concepts such as Taylor series, function approximation, and derivatives. The construction uses GeoGebra commands like Point, Textfield, TaylorSeries, Segment, and objects like c, a, A, f, inputBox1, B, g, b, text2, p, text4, text1, d, e, inputBox2 to visualize the approximation process. Suitable for high school and above mathematics learners to understand the principles and applications of function approximation.
GeoGebra Commands & Parameters
Point(a) → ATextfield(f) → inputBox1TaylorSeries(f, x(A), c) → gSegment(B, A) → bTextfield(c) → inputBox2
AI Drawing Prompt Reference
Draw a graph of a function f(x) and its Taylor series approximation g(x). First, mark a point on the x-axis, then input the function f(x), calculate the Taylor series g(x) at that point, and set the expansion point c. Finally, draw a segment connecting the point and the value of c.
The prompt above was compiled from the original drawing commands and is for reference only.