
Sine and Cosine Graphs by DavidA
Loading the math board and drawing, please wait…
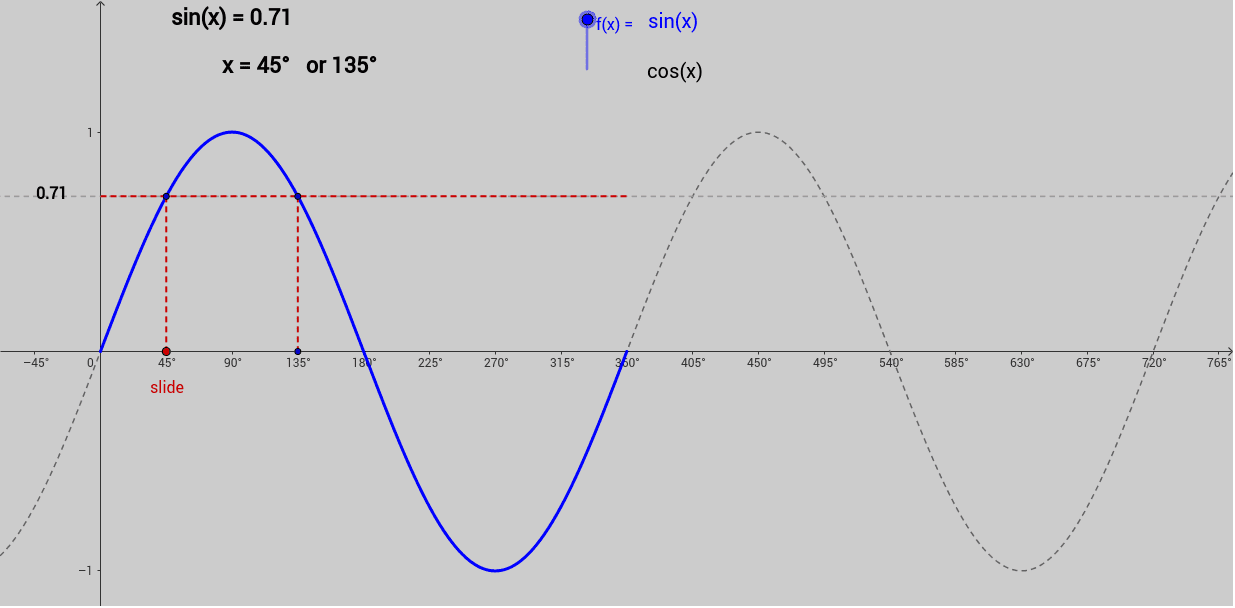
This example illustrates angles with the same trigonometric ratio using the graphs of sine and cosine. It covers core trigonometry concepts and uses GeoGebra commands like Segment, Point, If, and Function. Suitable for high school math education to help students understand the properties of sine and cosine functions.
GeoGebra Commands & Parameters
Segment(A, B) → bPoint(b) → CIf(a ≟ 1, 180 - sol1 + If[sol1 ≥ 180, 360, 0], 360 - sol1) → sol2Function(i, 0, 360) → fFunction(v, 0, 360) → gSegment(D, C) → dSegment(E, F) → ePoint(c) → G
AI Drawing Prompt Reference
Draw the graphs of sine and cosine functions. First, draw a line segment b between points A and B, then take point C on segment b. Next, plot the sine and cosine functions from 0 to 360 degrees, and use line segments d and e to connect point C to other points. Finally, add point G to the graph.
The prompt above was compiled from the original drawing commands and is for reference only.