
Tape Diagrams in Algebra (with examples) by artipal81
Loading the math board and drawing, please wait…
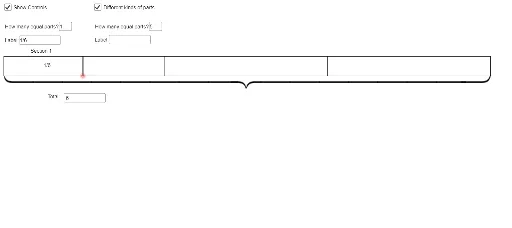
This example demonstrates how to use tape diagrams to solve algebraic problems, involving core concepts like ratios, percentages, and logical reasoning. Constructed with GeoGebra commands including Textfield, Polygon, Point, Segment, Midpoint, and Sequence, it is suitable for middle school students and teachers learning algebra.
GeoGebra Commands & Parameters
Textfield(m) → InputBox1Textfield(text5) → InputBox2Textfield(n) → InputBox3Textfield(text6) → InputBox4Textfield(text7) → InputBox5Polygon(A, B, C, D) → poly1, a_1, b, c, dPoint(poly1) → ESegment(E, F) → fMidpoint(D, F) → GMidpoint(F, C) → HSequence(Segment[A + ((i_1 * (k - 1)), 0), A + ((i_1 * (k - 1)), h)], k, 1, m) → list1Sequence(Segment[E + ((i_2 * (p - 1)), 0), E + ((i_2 * (p - 1)), h)], p, 1, n) → list2Sequence(Segment[A + ((i_3 * (k - 1)), 0), A + ((i_3 * (k - 1)), h)], k, 1, m) → list3Sequence(Text[text6, (x(E) + (r * i_2) + i_2 / (n + 1), 0.7)], r, 0, n - 1) → list2tSequence(Text[text5, (x(A) + (q * i_3) + i_3 / (m + 1), 0.7)], q, 0, m - 1) → list3tSequence(Text[text5, (x(A) + (q * i_1) + i_1 / (m + 1), 0.7)], q, 0, m - 1) → list1t
AI Drawing Prompt Reference
Draw a tape diagram for algebra problems, featuring two input boxes for variables m and n, a polygon at the bottom, and two sets of parallel line segments controlled by sliders, each set representing values of the respective variables with corresponding numbers labeled on the segments, illustrating logical reasoning with ratios and percentages.
The prompt above was compiled from the original drawing commands and is for reference only.